Coast Survey announces plans for 2015 NOAA survey projects

2015 survey plan outlines

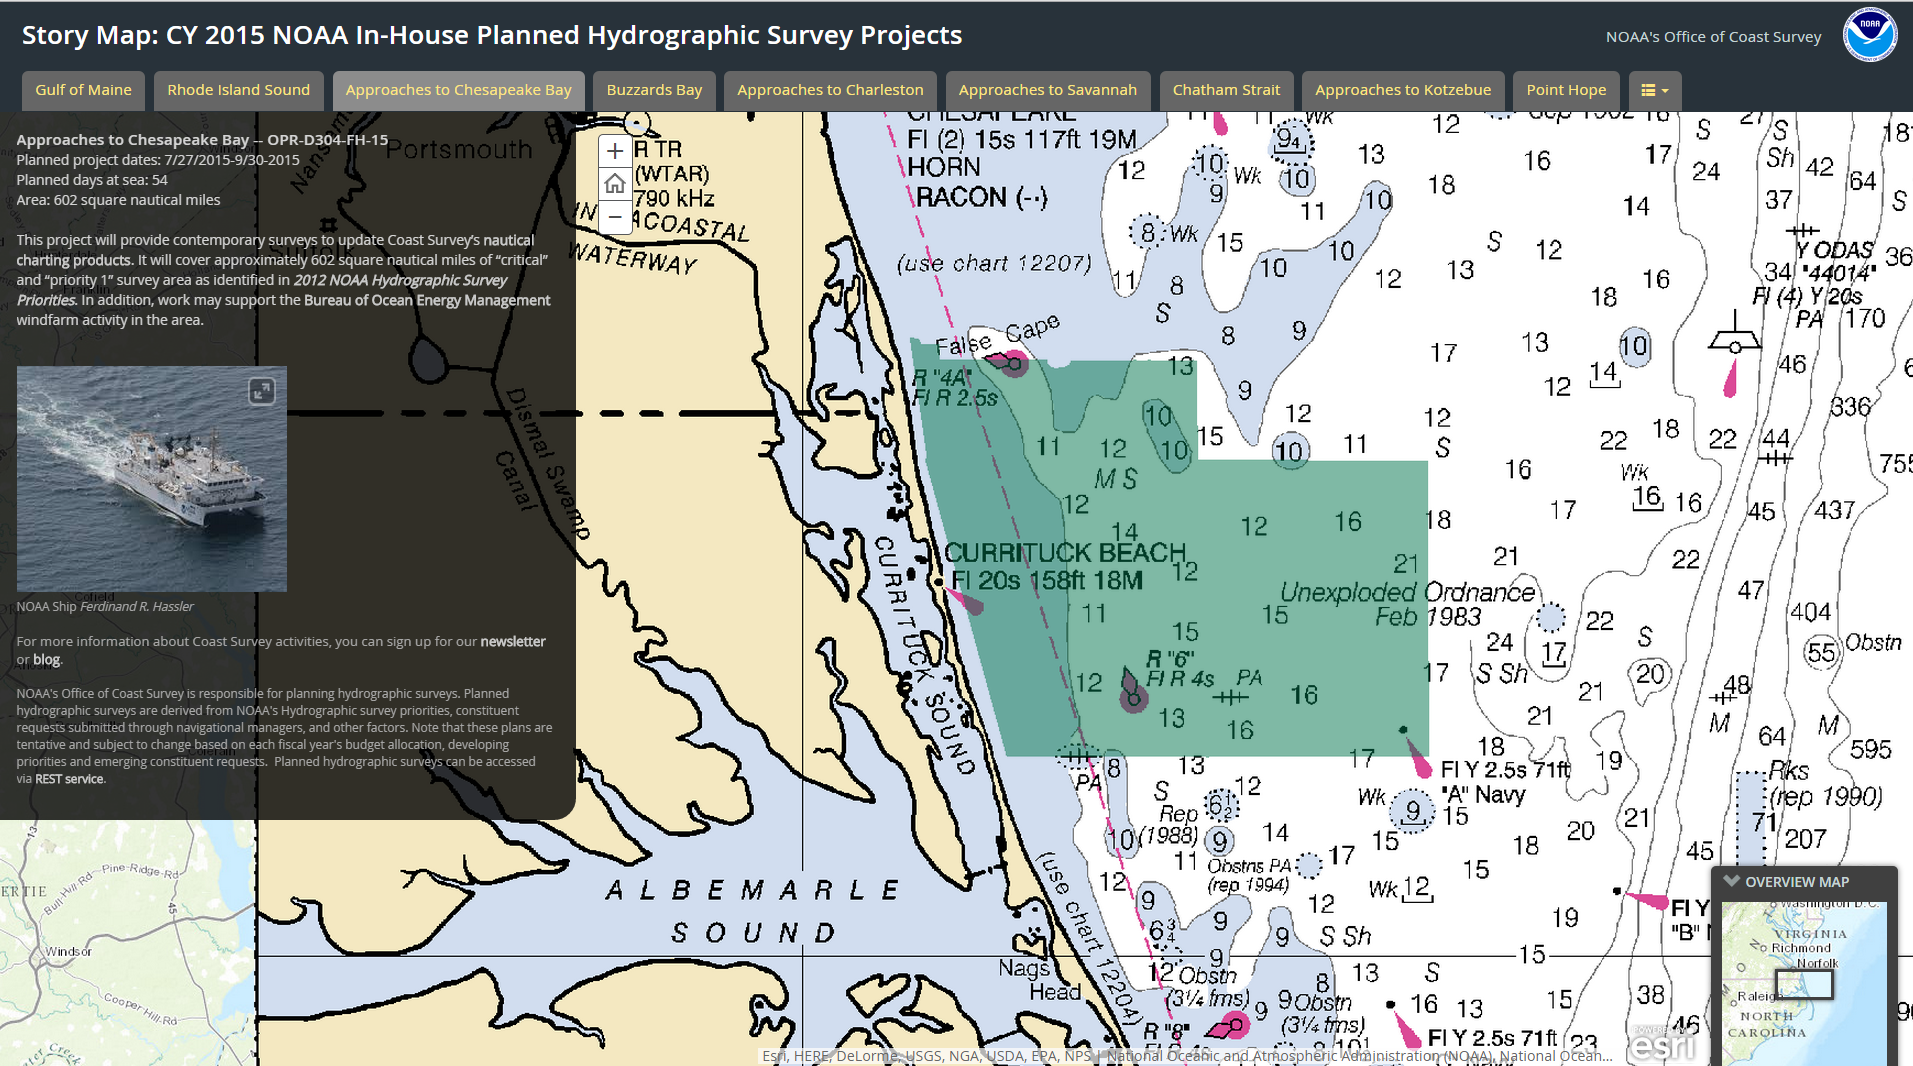
In 2015, NOAA survey ships Thomas Jefferson and Ferdinand R. Hassler are scheduled to survey nearly 1,800 square nautical miles in the U.S. coastal waters of the lower 48 states, collecting data that will update nautical charts for navigation and other uses. In Alaska, NOAA ships Fairweather and Rainier will increase their Arctic operations, planning to acquire 12,000 nautical miles of “trackline” depth measurements of the U.S. Coast Guard’s proposed shipping route. (See this NOAA article.) The ships will also conduct several “full bottom” hydrographic survey projects, acquiring data from over 2,800 square nautical miles in survey areas along the Alaskan coastline.
We are also planning several projects for our contractual private sector survey partners, and those projects will be announced after work orders are finalized.
Continue reading “Coast Survey announces plans for 2015 NOAA survey projects”

Explore once, use many times

OE Survey W00286

This post is adapted from a poster at the U.S. Hydro 2015 conference, in National Harbor, Maryland.

Pilot project shows nautical charting applications using NOAA Ship Okeanos Explorer data

By
James J. Miller and Tyanne Faulkes, physical scientists, NOAA Office of Coast Survey, Atlantic Hydrographic Branch
Lindsay McKenna, physical scientist, ERT Inc. contractor with the NOAA Office of Ocean Exploration and Research
Mapping is the foundation of ocean exploration and marine spatial planning. In its mission to explore and broaden our knowledge of the oceans, the NOAA Ship Okeanos Explorer has collected high-resolution multibeam data as an integral part of its operations around the globe. Since 2013, the Office of Coast Survey has collaborated with the Okeanos Explorer during their expeditions, to improve hydrographic acquisition and processing methods and expand multibeam coverage in the Gulf of Mexico and Atlantic Ocean. The resulting bathymetry has supported a diverse array of oceanic research and contributed to the protection of ecologically critical habitats in U.S. waters.
Continue reading “Explore once, use many times”

NOAA hydro officers honored

Megan Guberski

Each year, the NOAA Association of Commissioned Officers recognizes NOAA Corps officers for their extraordinary accomplishments and contributions. This year, three of the four awards went to officers supporting Coast Survey’s hydrographic program. Congratulations to the officers honored with Junior Officer of the Year, Engineering, and Science awards. Coast Survey applauds your accomplishments!
Continue reading “NOAA hydro officers honored”

Celebrating Abe’s birthday! Lincoln’s slave density map is home again in President Lincoln Cottage

The “slave density map,” created by the men of U.S. Coast Survey in 1861, is one of Coast Survey’s most treasured historical maps. Artist Francis Bicknell Carpenter included it in his painting, “First Reading of the Emancipation Proclamation of President Lincoln,” because Lincoln consulted it so often in devising his military strategy. According to Carpenter, President Lincoln used the map in his decisions to send his armies to free blacks in some of the highest density areas in order to destabilize Southern order.
Continue reading “Celebrating Abe’s birthday! Lincoln’s slave density map is home again in President Lincoln Cottage”

So you want to chart an artificial reef?

There are literally millions of pieces of data on nautical charts. How do cartographers determine which data to put on the charts? Two Coast Survey cartographers, Paul Gionis and Lance Roddy, explained some of the processes, protocols, and NOAA charting requirements to participants at the Florida Artificial Reef Summit earlier this month. (See the archived video of their presentation, starting at 55:40.) Among their many duties, these cartographers are responsible for vetting artificial reef public notices and permits from the U.S. Army Corps of Engineers, and for acquiring source data from the state and county reef coordinators.
By explaining the nautical chart aspects of planning, creating, and maintaining fish havens, they hoped to smooth out the permitting and charting phases.
Continue reading “So you want to chart an artificial reef?”

NOAA Open House to share scientific awesomeness

Explore your world and learn how NOAA — the National Oceanic and Atmospheric Administration — takes the pulse of the planet every day and protects and manages ocean and coastal resources. 2015 NOAA Open House Ad

Join us on NOAA’s Silver Spring, Maryland, campus for a day of discovery. Listen to engaging talks by NOAA experts, explore interactive exhibits, take special tours, and have fun with hands-on activities for ages 5 and up. Meet and talk with scientists, weather forecasters, hurricane hunters, cartographers, and others who work to understand our environment, protect life and property, and conserve and protect natural resources.
Continue reading “NOAA Open House to share scientific awesomeness”

NOAA Coast Survey 2015 leadership team

NOAA’s Office of Coast Survey enters 2015 with a leadership team that is ready to transform the nation’s hydrographic data acquisition and maintenance program, making coastal data more easily accessible for digital applications that include navigation and coastal planning. We thought you might like to know who those leaders are…
Director, Coast Survey: Rear Admiral Gerd F. Glang
RDML Gerd Glang formal2Rear Adm. Glang was appointed as director of Coast Survey in August 2012. A NOAA Corps officer since 1989, Glang is a professional mariner, specializing in hydrographic surveying and seafloor mapping sciences. He has served aboard four NOAA ships, working in the waters of all U.S. coasts, from the largely uncharted coastal waters of Alaska’s southwest peninsula to the South Pacific. He was commanding officer of NOAA Ship Whiting in 1999, when the ship responded to the seafloor search for John F. Kennedy, Jr.’s, downed aircraft. Just three months later, he led Whiting to the first discovery of the seafloor debris fields from Egypt Air Flight 990. Ashore, Glang has led NOAA work in hydrography, cartography, and planning. A 1984 graduate of the State University of New York Maritime College with a bachelor’s degree in engineering, Glang also received a graduate certificate in ocean mapping from the University of New Hampshire Center for Coastal and Ocean Mapping, and is a graduate of the Harvard Kennedy School Senior Executive Fellows program.
Continue reading “NOAA Coast Survey 2015 leadership team”

Coast Survey wants your thoughts about chart catalogs

Regular blog readers are aware of NOAA chart transformations over the last year, as we transition our nautical products to a wide range of paper and digital formats, print-on-demand services, and web mapping ‒ providing updated information that is easy to access. Next up for consideration is the traditional chart catalog. In a Federal Register Notice published on November 28, we ask for your opinion.
Until April 2014, the Federal Aviation Administration had printed NOAA’s nautical chart catalogs on oversized paper sheets (up to 35 inches by 55 inches), folded them, and made them available to the public for free. Since the printing was done in bulk, and stored prior to distribution, the information on the reverse side of the catalogs was often out of date by the time catalogs reached customers. When the FAA ceased printing NOAA nautical charts in April, they also stopped printing the catalogs.
Continue reading “Coast Survey wants your thoughts about chart catalogs”

Public has new web access to NOAA hydro survey plans

With over 3.4 million square nautical miles of U.S. waters to chart, NOAA’s Office of Coast Survey is constantly evaluating long-term hydrographic survey priorities. Now, for the first time, Coast Survey is posting its three-year survey plans and making them publicly available at the Planned NOAA Hydrographic Survey Areas (2015-2017) in ArcGIS Online. In addition to seeing the outlines of planned survey areas for the next three years, users can obtain additional metadata (project name, calendar year, and area in square nautical miles) for each survey by simply clicking on the outlines. Other features display the survey area information in a tabular format, and can filter the information using metadata fields.

The new Planned NOAA Hydro Survey map color codes project areas by year. Clicking on the outline gives additional information.
The new Planned NOAA Hydro Survey Area map color codes project areas by year. Clicking on the outline gives additional information.

Continue reading “Public has new web access to NOAA hydro survey plans”