By Starla Robinson, project manager in Coast Survey’s Hydrographic Surveys Division
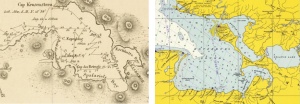
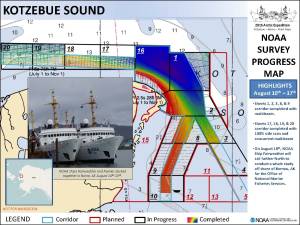
Two hundred years after Otto von Kotzebue and the crew of the Ruiric explored what would later be named Kotzebue Sound, NOAA ships Fairweather and Rainer follow in the same tradition. Two centuries ago they were searching for the Northwest Passage in support of trade. Today, we explore to improve the science and safety of navigation in support of commerce, environmental protection, and local communities. Our bathymetric data and observations will also be used to better inform coastal decision-making.

Many things have changed since the crew of the Ruiric braved these waters. However, operations in the Arctic are still challenging. For much of the year Kotzebue Sound is frozen over. The remote location makes arriving and maintaining basic needs of the ships and crew difficult–just being here is a success.
Technology has made navigation safer and surveying more efficient. For example, rather than the discrete lead lines that were once used to obtain depth measurement data in this project area (which is about the size of Delaware), multibeam echo sounders acquire the same amount of data in just one square meter. For multibeam surveys, the speed of sound must be measured in the water column and the motion of the vessel must be recorded and corrected in the data. We use side scan sonar to produce imagery of the sea floor. GPS is used to triangulate our position rather than sailors taking bearings on shore stations. To better refine our precision, we construct horizontal and vertical control stations that must be operational before bathymetry data can even be collected.
It takes teamwork on and off the ship and NOAA has brought together many resources. Contractors are used to establish vertical control stations recording water levels. The Center for Operational Oceanographic Products and Services (CO-OPS) monitors the data and creates tide models. Subject matter experts in side scan sonar assist with the surveying effort. Teams on land plan and support the expedition and continue to process the data for the chart after the ships have left. Many things have to align to make our charting efforts a success.
On the ship, our exposed location limits survey activities. The small boats for survey can only be deployed when the sea state is safe. Teams must brave the surf to maintain the control stations. The crews of the Rainier and Fairweather work hard to take advantage of windows of good weather. They work long hours, in rough conditions, away from convenience and family, in pursuit of the chart. We are today’s explorers seeing the full picture of the seafloor for the first time.

