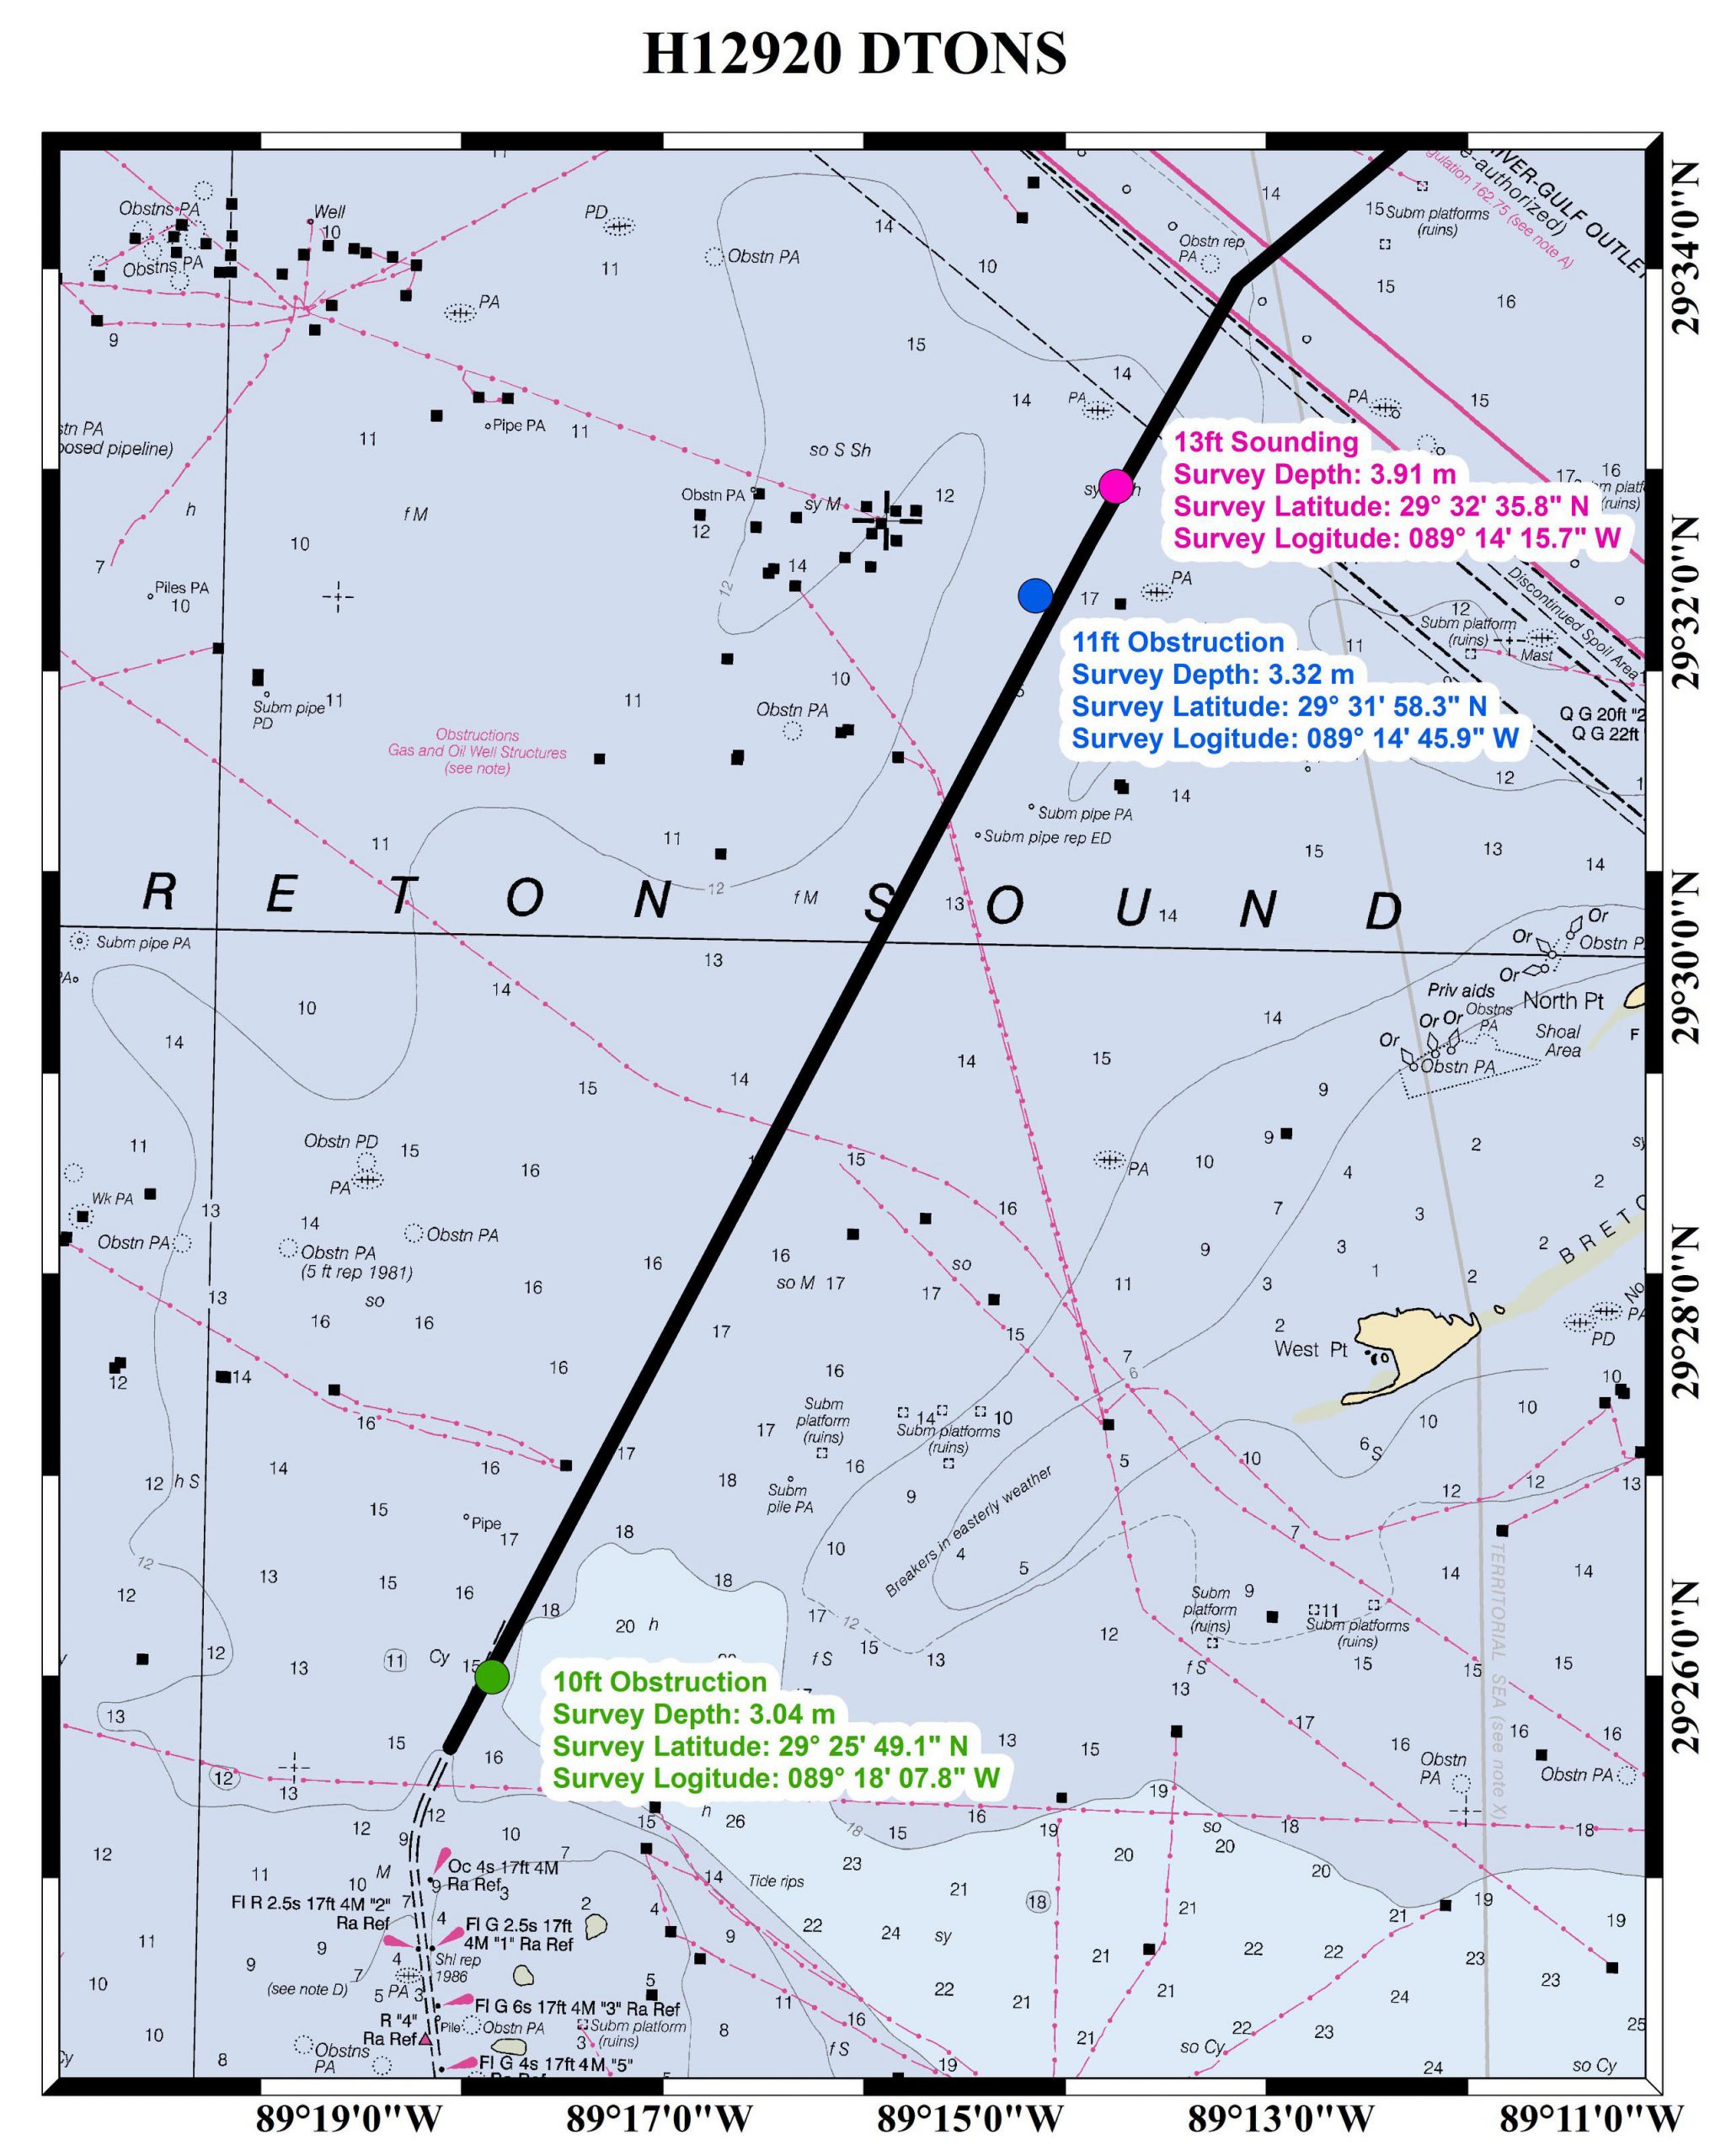
The Inner Harbor Navigation Channel in New Orleans facilitates the transportation of tens of millions of tons of cargo each year. Since the channel was recently closed for repairs, a temporary Chandeleur Sound Alternate Route was established to ensure the flow of commerce between the western and eastern reaches of the Gulf Intracoastal Waterway. NOAA experts assisted with the alternate route development in various ways, collaborating with the U.S. Coast Guard, U.S. Army Corps of Engineers, and the maritime industry. Continue reading “Assisting tow industry along Chandeleur Sound Alternate Route”
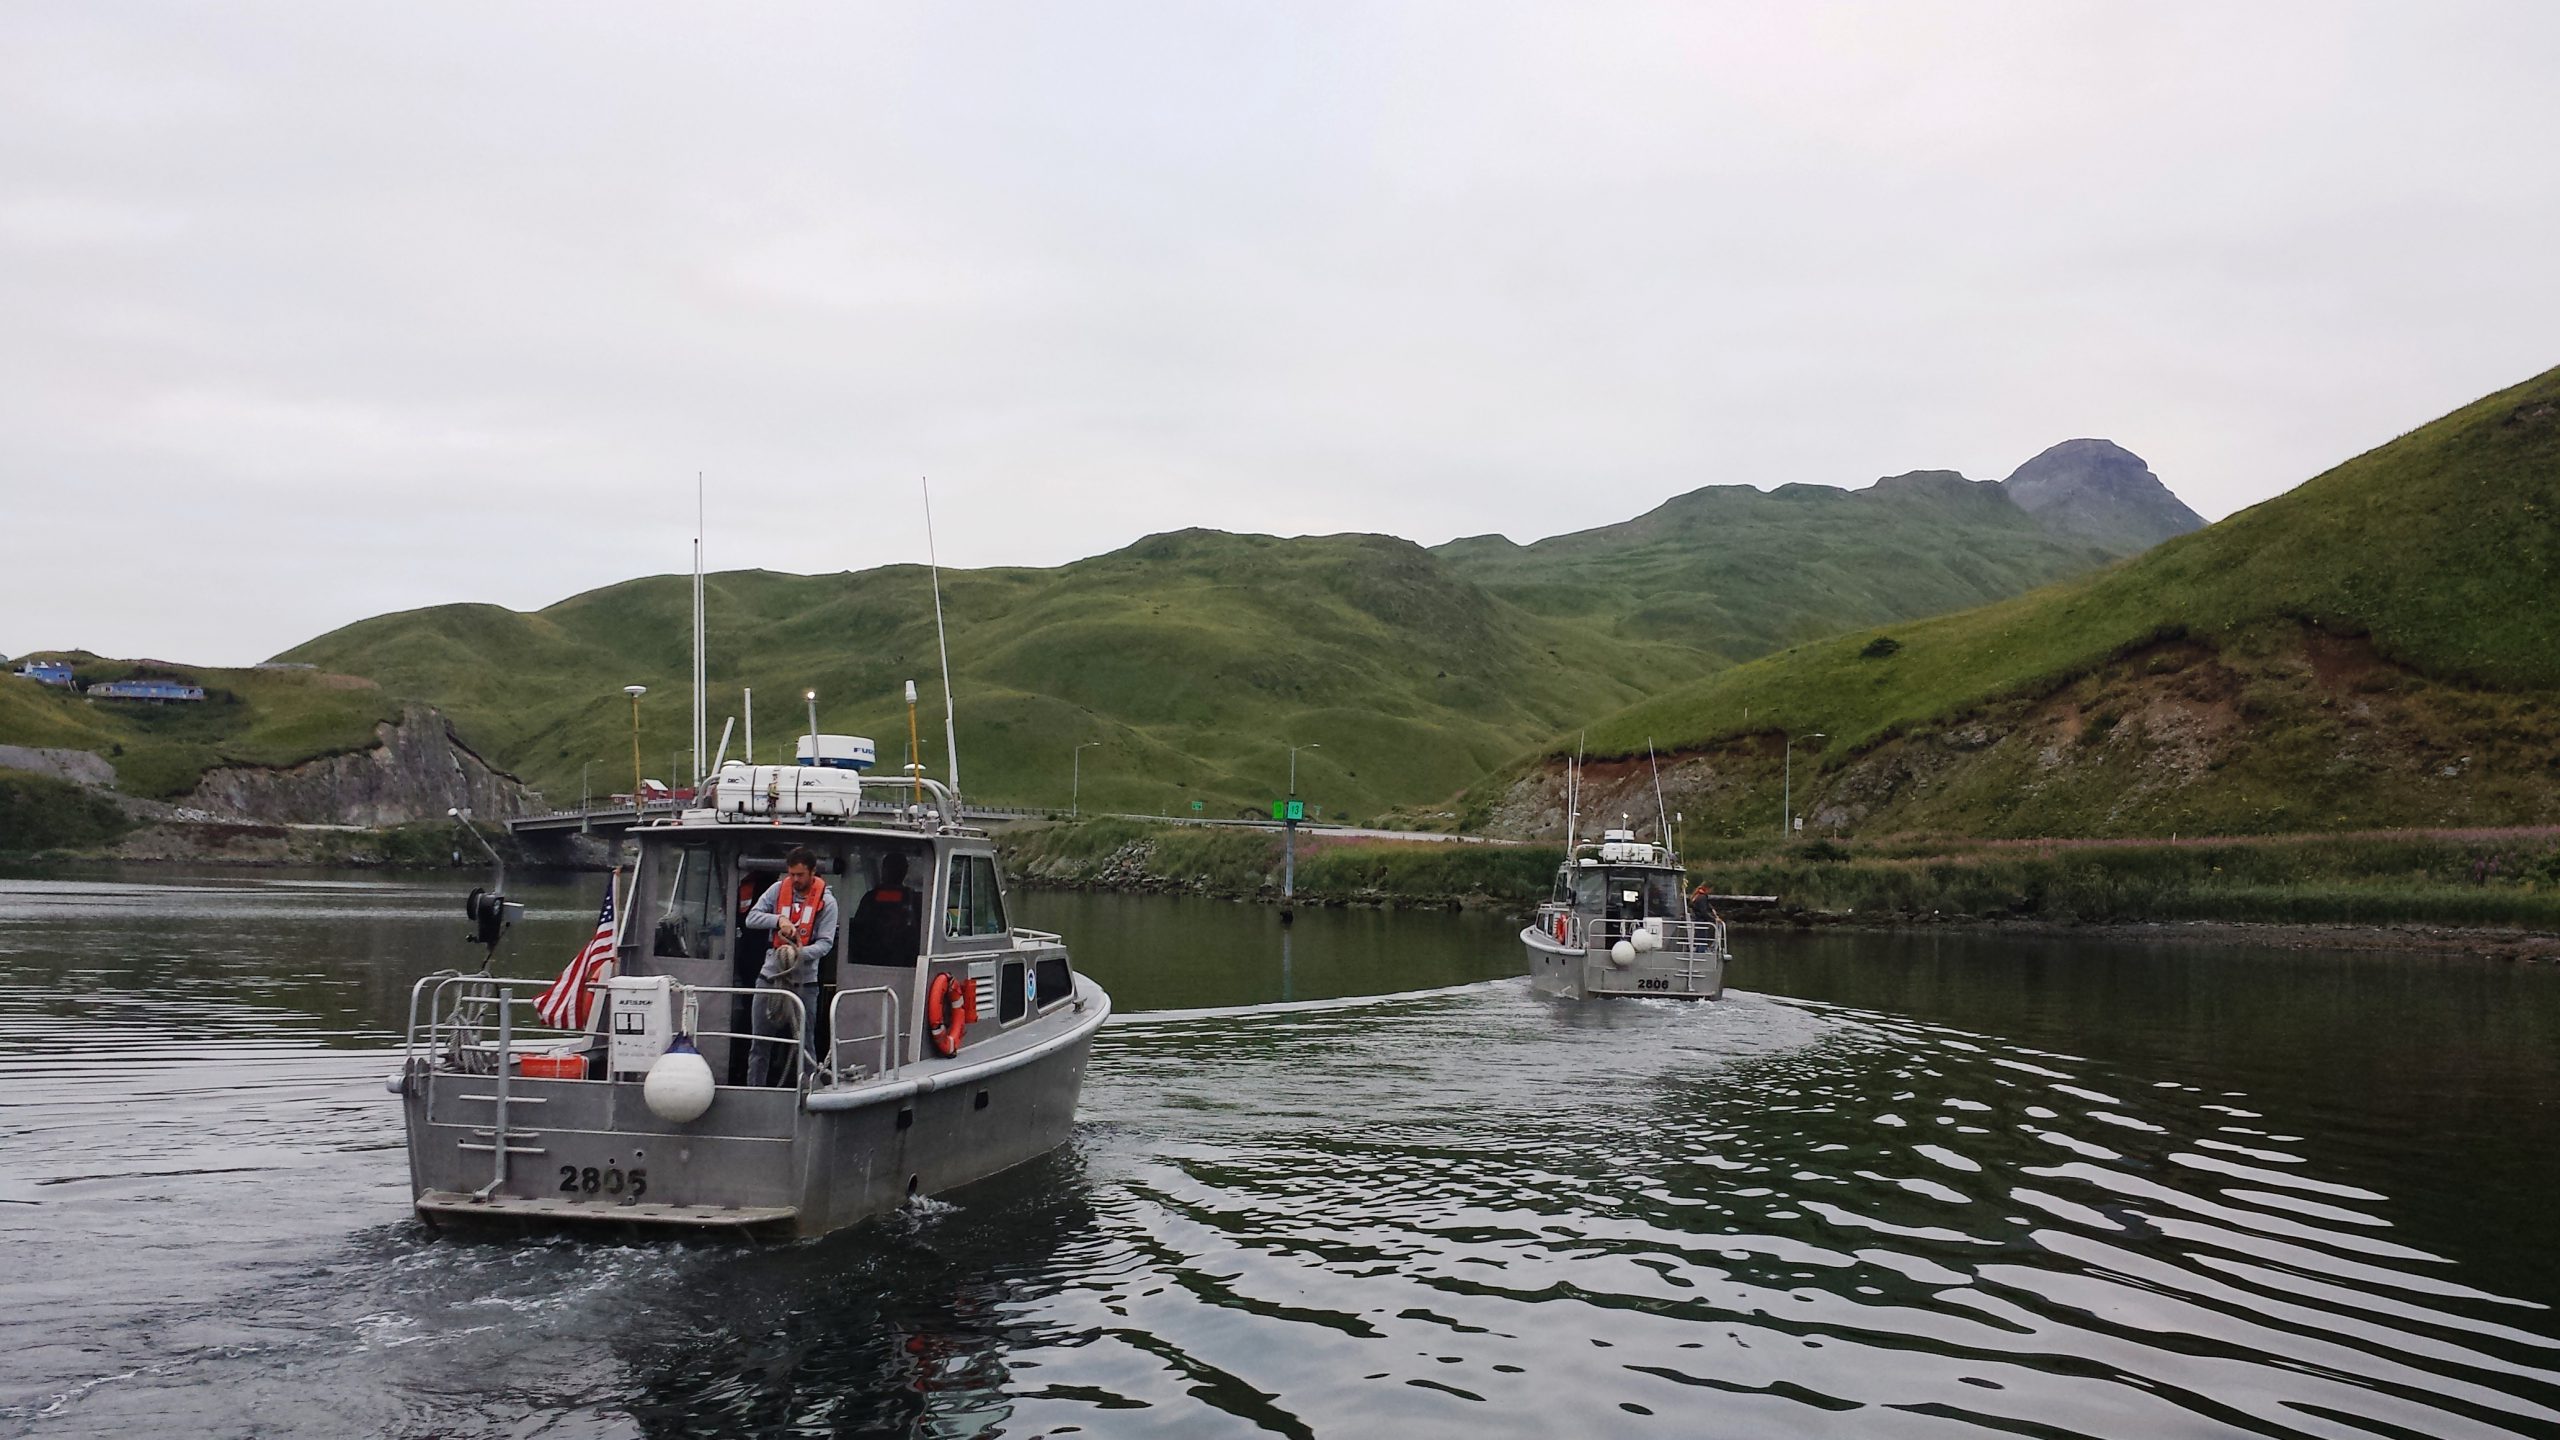
In a unique deployment of resources, last week NOAA Ship Fairweather split its scientific team and vessels to tackle two distinct projects in Alaska. Coast Survey physical scientist Katrina Wyllie and Lt.j.g. Bart Buesseler report on the multi-mission projects.
***
On August 9, NOAA Ship Fairweather departed Dutch Harbor, Alaska, for a FISHPAC project, led by Dr. Bob McConnaughey from NOAA’s Alaska Fisheries Science Center. This project’s primary mission is to statistically associate acoustic backscatter returns with the abundances of fish and crabs that frequent the Bering Sea seafloor. The science team accomplishes this with acoustic data from multibeam, single beam, and side scan sonars. Understanding the value of acoustic backscatter as a habitat-defining character will help scientists understand where fish live and the importance of different habitats. The acoustic data will also be used to correct for differences in the performance of research bottom trawls on different seafloor types, so that stock assessments and fishery management can be improved. To make sure the scientists understand what the acoustic data are showing, each day the ship will stop and collect physical bottom samples of the seafloor to see, touch, and interpret their findings. Further increasing the effectiveness of this mission, all of the multibeam bathymetry data acquired will directly support NOAA’s Office of Coast Survey as the data will be used to update soundings on the nautical charts for the eastern Bering Sea where the ship will be operating. Continue reading “NOAA Ship Fairweather begins multi-mission projects in Alaska”
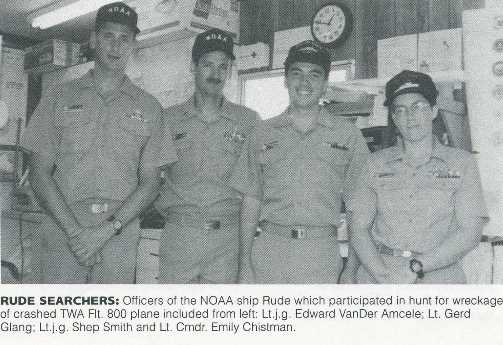
On this date in 1996, twenty years ago, the crew of NOAA Ship Rude completed her special mission and headed back to regular survey duties. Throughout the previous two weeks, Rude’s officers and crew were pivotal in finding the wreckage of – and helping to bring closure to – one of the worst aviation disasters in U.S. history.
From a 1996 report by then-Cmdr. Nick Perugini, NOAA’s Office of Coast Survey, we have this description:
“When TWA Flight 800 exploded out of the sky this summer, NOAA hydrographic survey vessel Rude began a dramatic journey which would test to the limit skills and resources of its officers and crew, and bring to national attention the agency’s hydrographic capabilities.
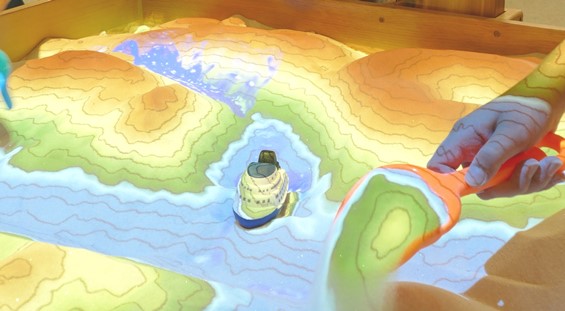
Congratulations to our colleagues in Seattle for hosting a terrific NOAA Science Camp this month! Held at NOAA’s Seattle Sand Point facility each July, NOAA Science Camp offers opportunities for middle school students and high school students.
Thanks to Coast Survey experts stationed at our Pacific Hydrographic Branch, a section of the classes was focused on hydrography. Kids learned about bathymetry and the importance of hydrographic surveys for shipping. They saw how high-resolution sonar data is used for tsunami modeling and fish habitat. Continue reading “NOAA Science Camp brings hydro education to life”
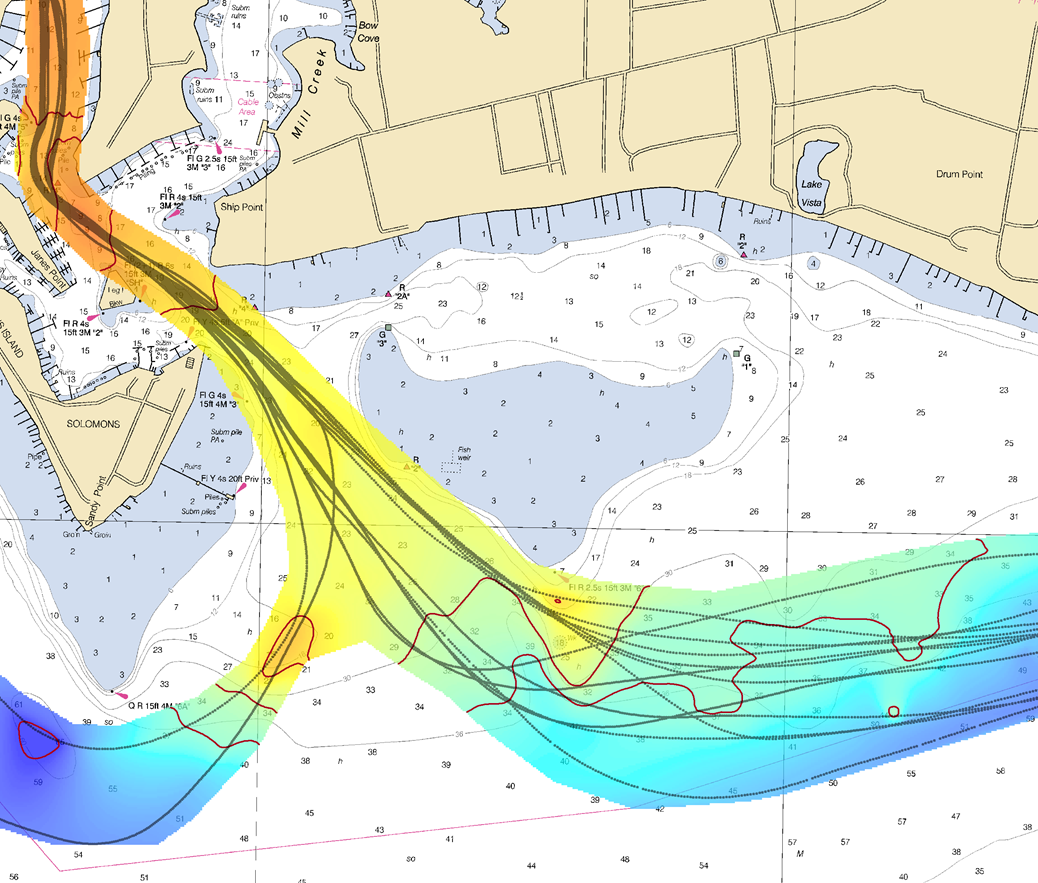
Cartographers and hydrographers from twelve countries gathered in Maryland last week to participate in a three-day NOAA workshop on evaluating the adequacy nautical charts. During the workshop, they learned techniques to evaluate the suitability of nautical chart products using chart quality information and publicly available information. The participants then generated key layers in adequacy assessments:
Using automatic identification systems (AIS) information to classify navigational routes, they generated a vessel traffic layer.
Comparing satellite-derived bathymetry or other surveys of opportunity with the existing chart, to identify areas that showed significant bathymetric changes, they generated a bathymetric difference layer.
Classifying chart quality information, they generated a hydrographic characteristics layer.
Coast Survey introduces new service for downloading raster chart updates
We click on our smart phone map app, and we can immediately see any place on land. We turn on our boat’s navigational system and a nautical chart appears. Where do the apps get their maps and charts, and how often are they updated? Let’s look deeper into the chart services…
Recreational boaters use chart plotters and computer-based navigation systems, including tablets and mobile devices — at last count, there are over 60 mobile apps — as well as web mapping applications. These commercial products often use privately produced charts derived from official NOAA raster navigational charts (NOAA RNC®). In recent years, larger manufacturers have switched to using NOAA raster charts themselves. Until recently, the systems had to work through a major problem: each of NOAA’s thousand charts is a huge file that takes bandwidth and time to upload. So the entrepreneurs developed work-arounds, especially when they needed to update the charts. Many of them cut NOAA chart files into more manageable “tiles.” Many didn’t update these chart tiles for months, or sometimes even up to a year, despite NOAA issuing updates weekly, often because of time and storage space problems. Continue reading “Updating digital nautical charts is faster and easier”
We are on the verge of acquiring a significant new source of data to improve NOAA nautical charts, thanks to an enthusiastic industry and mariners equipped with new technology.
By Lt. Adam Reed, Integrated Oceans and Coastal Mapping (IOCM) Assistant Coordinator
The United States has about 3,400,000 square nautical miles of water within our coastal and Great Lakes jurisdiction. Coast Survey, who is responsible for charting that vast area, averages about 3,000 square nautical miles of hydrographic surveying each year. The data collected by those surveys update over a thousand NOAA charts. However, hydrographic surveys are expensive and laborious, and so Coast Survey directs them toward the highest priority sites, which leaves many coastal areas without updates for many years.
Coast Survey may soon get new sources of information, provided voluntarily by mariners, which will alert cartographers to areas where shoaling and other changes to the seafloor have made the chart inaccurate. Continue reading “Beta test of crowdsourced bathymetry holds promise for improving U.S. nautical charts”
Charts will provide more information on “zone of confidence”
It is a major challenge – some might say an impossibility – to keep all thousand U.S. nautical charts up to date. But exactly how out of date is the chart data? Chart users will get a better idea now that Coast Survey is gradually rolling out a new chart feature called the zone of confidence, or “ZOC” box. It will replace the source diagram that is currently on large-scale charts. Source diagrams, and now the improved ZOC, help mariners assess hydrographic survey data and the associated level of risk to navigate in a particular area.
The first charts to show the new ZOC box are 18622, 18682, 18754, and 11328. They were released on April 7. Continue reading “How accurate are nautical charts?”
Among women trailblazers, there is one who may not be sufficiently recognized: Maria Mitchell, the first female professional employed by Coast Survey. March is Women’s History Month, so it is especially appropriate to introduce this extraordinary woman to the Coast Survey audience.
According to the National Women’s History Museum, Mitchell “probably was the first woman employed in a professional capacity by the federal government. Although women had been hired as cooks, laundresses, etc., her 1849 employment appears to be the first case of a woman earning an annual salary for work based on knowledge of an academic field.” August 1, 1818 – June 28, 1889
Actually, Coast Survey records indicate that she began her Coast Survey career in August 1845, when the agency hired her as an astronomic observer, based in Nantucket. Coast Survey Superintendent Alexander Dallas Bache asked Marie and her father, William Mitchell, to assist in observations associated with a project to establish a cardinal point for latitude and longitude for the United States and North America. Records indicate that Bache paid her $300 a year.
Retired NOAA Captain Albert “Skip” Theberge has woven Maria Mitchell’s story into his history of the U.S. Coast Survey.
“Bache’s progressive, although somewhat tight-fisted, views on managing personnel led to the Coast Survey being the first federal agency to hire women for professional work both within its ranks as permanent personnel and on a contract basis. The astronomer, Maria Mitchell of Nantucket, was the pioneer in this radical departure from custom,” Theberge writes. Continue reading “Maria Mitchell: Coast Survey’s “indefatigable comet-seeker””
As a responsible boater, you examine your nautical chart before sailing, determined to avoid problems during a nice trip along the coast. Charts are packed with symbols and abbreviations, so you might refer to the free copy of U.S. Chart No. 1, which lists all of the symbols used on NOAA nautical charts. It is an excellent quick reference for identifying unfamiliar symbols.
However, sometimes mariners need a deeper understanding…
Coast Survey is now providing additional information about complex or particularly confusing chart symbols to augment what is available in U.S. Chart No. 1. The first two tip sheets are available now. Coast Survey will add more chart symbology tip sheets to the U.S. Chart No. 1 webpage as the need arises. Continue reading “New tips for understanding nautical chart symbols”

 As a responsible boater, you examine your nautical chart before sailing, determined to avoid problems during a nice trip along the coast. Charts are packed with symbols and abbreviations, so you might refer to the free copy of