
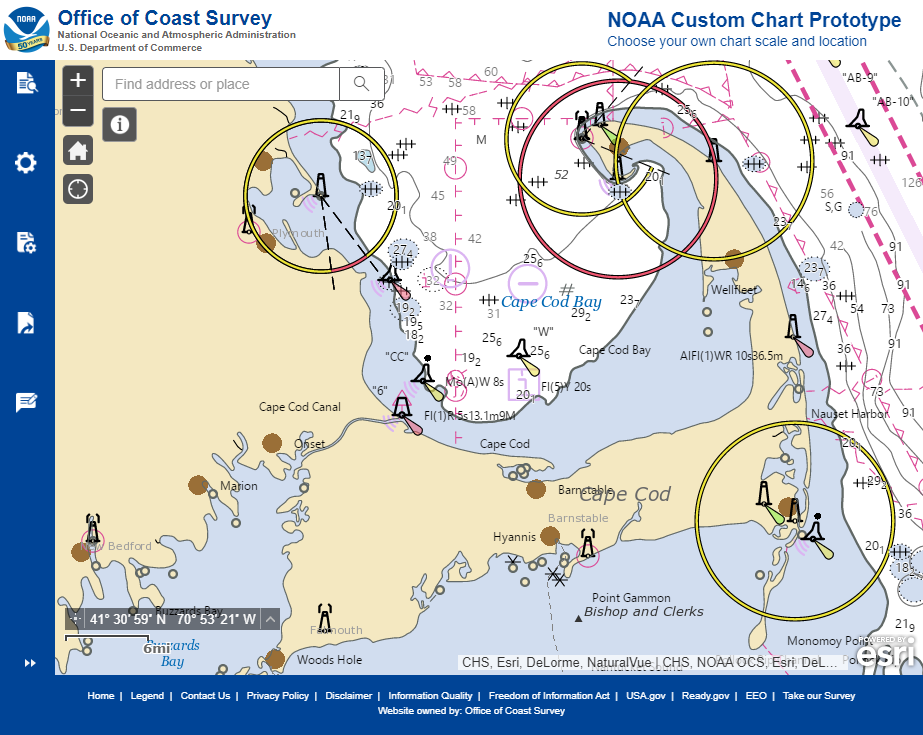
Recently, NOAA released an improved user interface for the NOAA Custom Chart (NCC) prototype web application, a tool that allows users to create their own charts from the latest NOAA electronic navigational chart (NOAA ENC®) data. In this refreshed version, NCC settings are simplified and more logically organized, appropriate default values for depth contour labels, depth shades, and compass roses are set, and the NOAA color palette from traditional NOAA paper charts is implemented.

Over the coming months, Coast Survey will improve the prototype further by incorporating traditional NOAA paper chart symbology for buoys, beacons, and lights, adding survey quality diagrams, improving chart note management and presentation, and also improving compass rose placement.
In late 2019, in conjunction with the announcement to end traditional paper nautical chart production, NOAA’s Office of Coast Survey debuted the custom chart prototype application. The NCC provides an easy way to create a paper or digital backup for electronic chart systems or other Global Positioning System (GPS) enabled chart displays. It creates a geospatially referenced Portable Document Format image of a nautical chart based on user-defined scale, paper size, and position of their choosing.Coast Survey considered many comments submitted during the public comment period following the initial release of the prototype when developing this latest version. Users can provide comments on the NCC through NOAA’s online ASSIST feedback tool.
Video Transcript
Today’s presentation on creating a NOAA custom chart will focus on setting chart limits and outputting your customized nautical chart. With the NOAA Custom Chart application, you can set the position, scale, and size of the chart that you want to create. For example, I’m planning a voyage from Nauset Lighthouse on Cape Cod to Brant Point on Nantucket Island. These two places are covered by two separate 1:80,000 scale nautical charts. I want to create a single 1:80,000 scale chart that covers the entire voyage. The custom chart application may be accessed from the Office of Coast survey website at nauticalcharts.noaa.gov. The application is still being developed. Click on this prototype announcement to start using the application.
There are five icons in the left side of the application window. The Quick Start Guide provides more tips on how to use the NOAA Custom Chart application. Display Settings controls certain aspects of the portrayal of data on your chart. Print Settings control the scale size and position of chart. The Export Queue shows all the chart extents that you created and allows you to name them and export them. The Feedback button provides an opportunity for you to let us know what you think of the application or to report errors.
I’m going to accept the display setting defaults and go to the print settings to set the scale size and position of the chart. I want to create a 1:80,000 scale chart. I’m going to use a 34 by 44 inch sheet. Then select your chart orientation, either portrait or landscape. You can use the plus or minus buttons or your mouse wheel to zoom in, and click and drag your mouse to pan to the position you want to create a chart at. Then click Create a New Extent button, center your cursor over the position you want to chart at and click. It may take a moment or two for the chart extent to appear in the map window. If the chart isn’t exactly where you want it to be, click on the Move Custom Extent button, and click and drag your chart to the desired location.
You can create multiple chart extents in the same session. I’m going to create a 1:40,000 scale chart over Martha’s Vineyard. Let’s make that a landscape chart. Go to the Export Queue to name your chart or delete extents that you want to discard. In this case, let’s get rid of that portrait orientation chart. Click on the Delete Extent after you’ve selected the chart in the queue, then click OK. You can tell which chart you’ve selected because it’s highlighted on the map window. Nauset Lighthouse to Brant Point. Martha’s Vineyard.
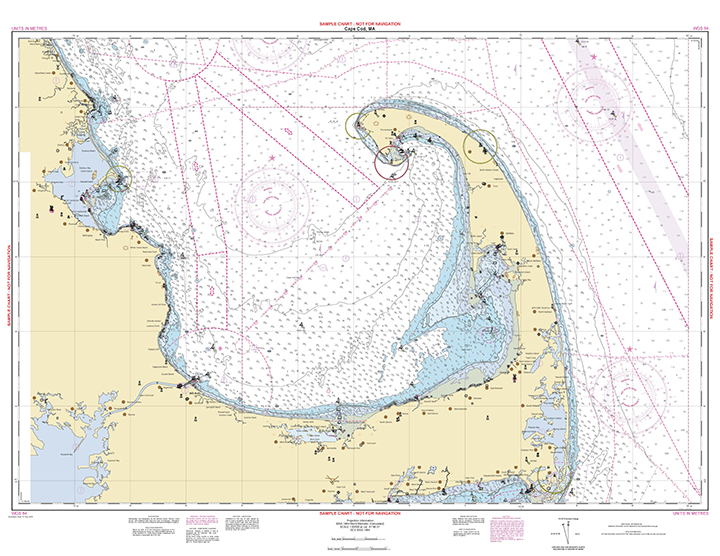
To export the chart, select a chart, and then click the Export Chart button. You can export multiple charts at the same time if you wish. This can take two or three minutes so we’re going to skip ahead and then I’ll show you the chart. Once the Open button appears the export is complete. Click the open button and your chart will appear in a new browser window. Then you can use your browser to save as or download function to save the chart to your computer. Once the chart is downloaded, it can be opened with any PDF viewer.
This is Nauset Lighthouse to Brant Point 1:80,000 scale chart. Nauset Lighthouse up here on Cape Cod. Brant Point here on Nantucket Island. All in one single chart. This Not for Navigation label will be removed after the NOAA Custom Chart prototyping phase has been completed.
This is super helpful. Thank you so much for putting this together.
How can one save Settings for later uses?
Hi,
Users are currently unable to save settings, however, it is hoped that users will be able to save some settings for individual charts soon, and possibly create a “template” of settings that could be saved to create charts with similar characteristics.
This is excellent thank you!
I would like to see a custom paper size option
In other words, can we change the aspect ratio! it would be useful to be able to expand or contract the chart extent boundaries with the cursor, and then click and drag to desired location
Thank you!