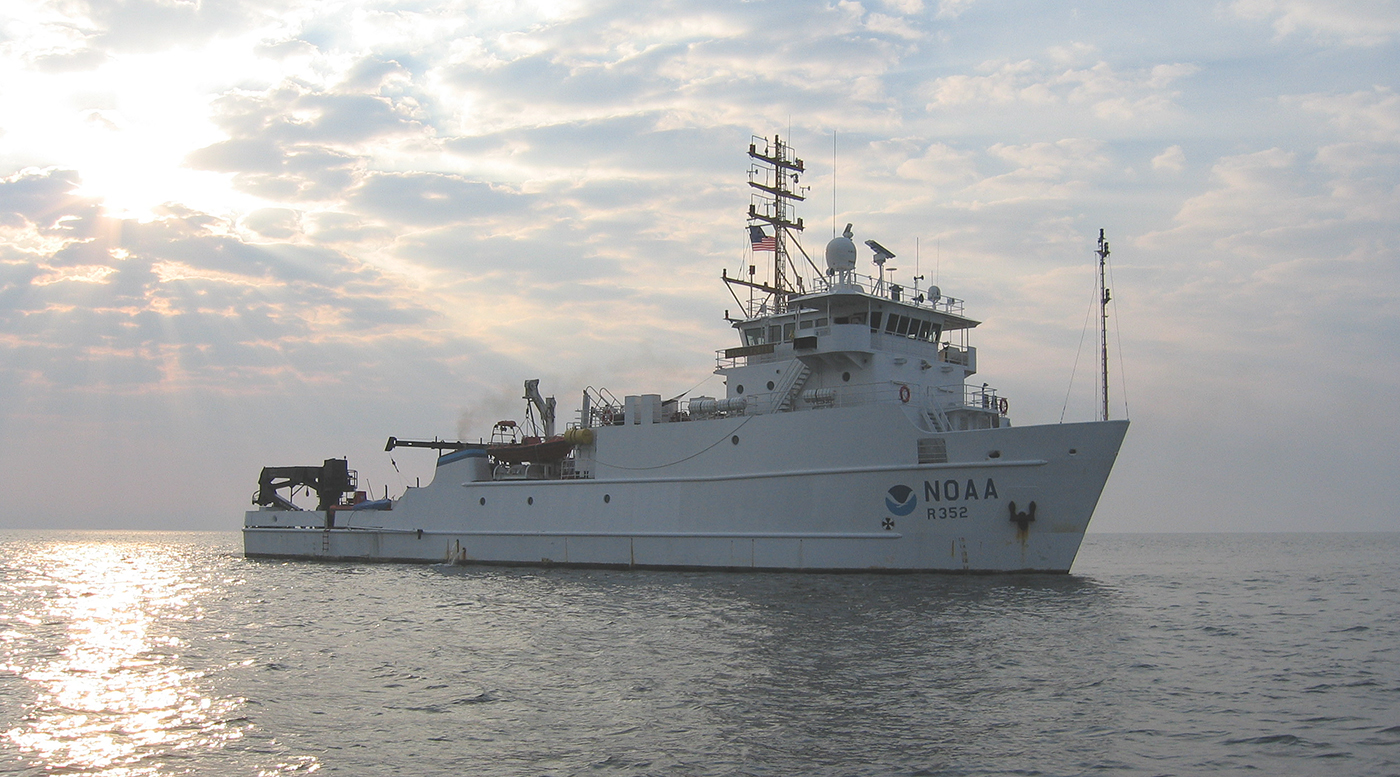
The Hydrographic Survey Specifications and Deliverables document contains the technical specifications for hydrographic survey data submitted to the Office of Coast Survey. It represents NOAA’s implementation of the International Hydrographic Organization standards for hydrographic survey and product specifications. Coast Survey is proud to announce the launch of the new Hydrographic Survey Specifications and Deliverables for 2024, the largest overhaul of the document in more than 20 years.
Continue reading “Technical specifications for submitting hydrographic survey data get an overhaul”The Interagency Working Group on Ocean and Coastal Mapping announces progress on mapping U.S. ocean, coastal, and Great Lakes waters
The federal Interagency Working Group on Ocean and Coastal Mapping recently released the fifth annual report on progress made in mapping U.S. ocean, coastal, and Great Lakes waters. Knowledge of the depth, shape, and composition of the seafloor has far-reaching benefits, including safer navigation, hazard mitigation for coastal resilience, preservation of marine habitats and heritage, and a deeper understanding of natural resources for sustainable ocean economies. The 2020 National Strategy for Mapping, Exploring, and Characterizing the United States Exclusive Economic Zone (NOMEC) makes comprehensive ocean mapping a priority for the coming decade. The Unmapped U.S. Waters report tracks progress toward these important goals.
Continue reading “The Interagency Working Group on Ocean and Coastal Mapping announces progress on mapping U.S. ocean, coastal, and Great Lakes waters”NOAA’s 2024 hydrographic survey season is underway
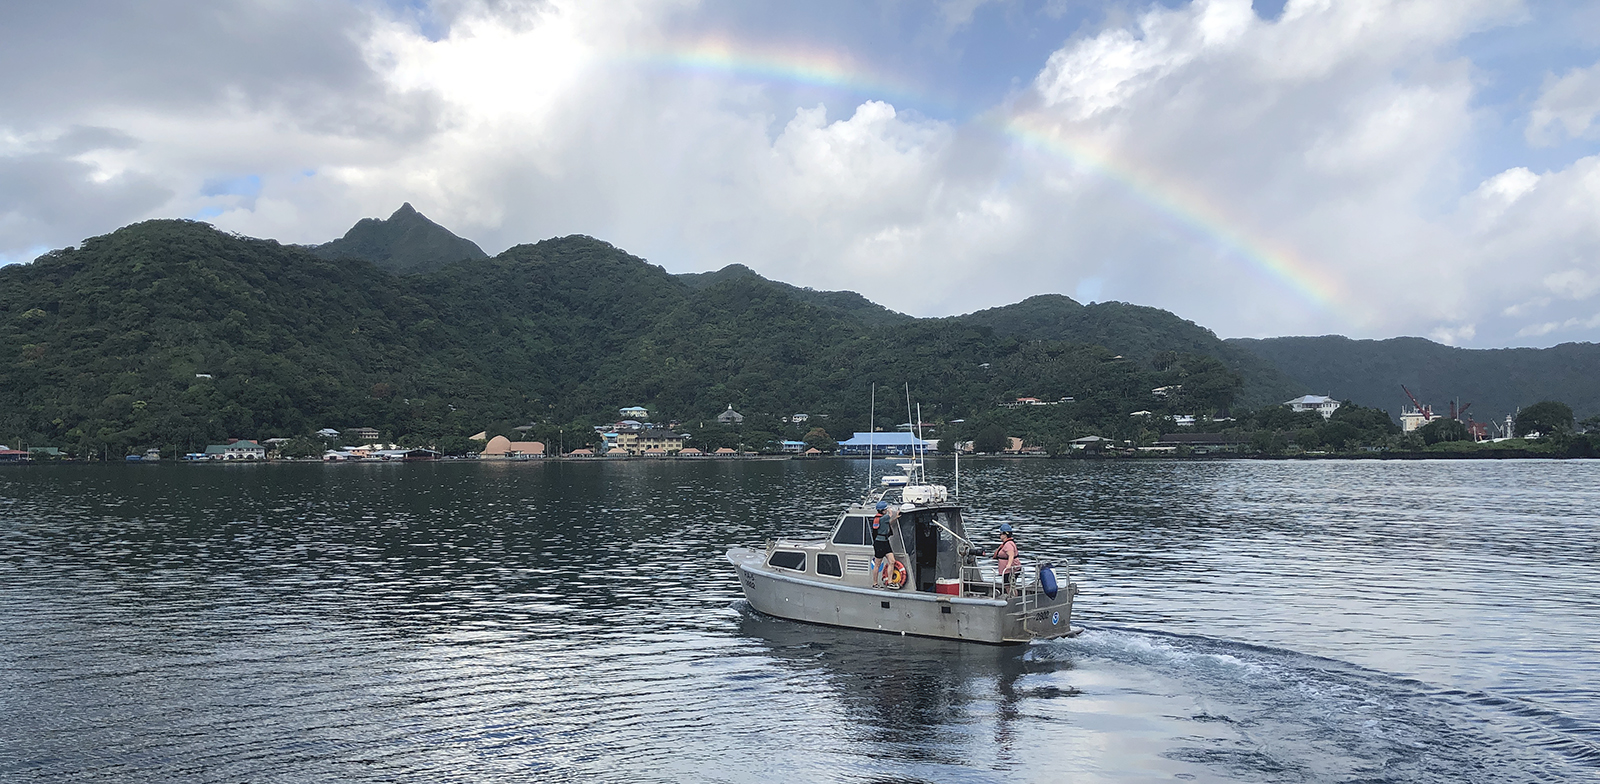
The National Oceanic and Atmospheric Administration’s 2024 hydrographic survey season is ramping up and will be in full swing before too long. For the past few months, NOAA hydrographic survey ships, navigation response teams, and contractors have been diligently preparing for the upcoming field season. The ships and survey vessels collect bathymetric data to support nautical charting, modeling, and research, but also collect other environmental data to support a variety of ecosystem sciences. NOAA considers hydrographic survey requests from stakeholders such as marine pilots, local port authorities, the Coast Guard, and the boating community, and also considers other hydrographic and NOAA science priorities in determining where to survey and when. Visit our “living” ArcGIS StoryMap to find out more about our mapping projects and if a hydrographic vessel will be in your area this year!
Continue reading “NOAA’s 2024 hydrographic survey season is underway”Possible Ancient River System Discovered off Wilmington, North Carolina
By Alexandra Dawson and Lt. Patrick Debroisse
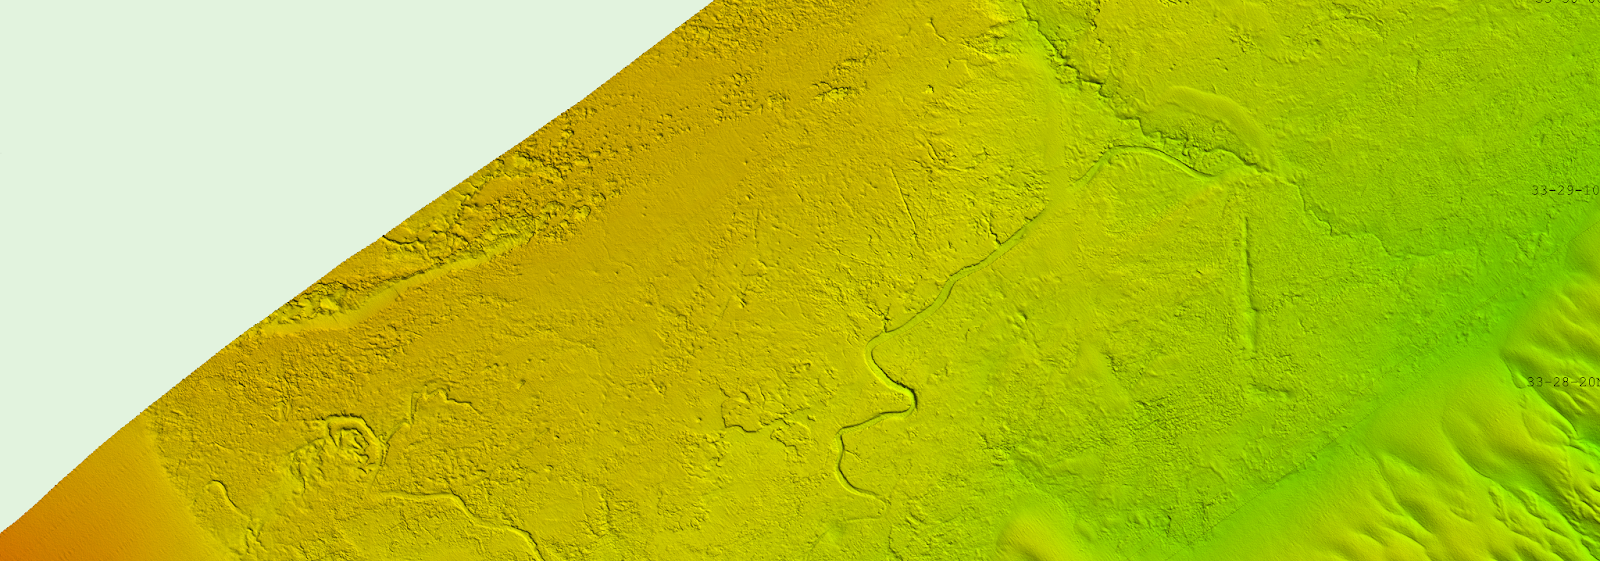
During the 2023 field season, NOAA Ship Ferdinand R. Hassler was tasked with surveying an area offshore of Wilmington, North Carolina, in the vicinity of Frying Pan Shoals—a dynamic area of dangerously shallow waters. While scientists and crew conducted mapping surveys of the seafloor, they discovered what is believed to be well-preserved ancient remnants of a paleochannel system that could give us a glimpse as to what our North Carolina coastline looked like approximately 20,000 years ago. The location of these newly discovered paleochannels indicates that they may have once been part of North Carolina’s historic Cape Fear River and likely were above sea level during the Last Glacial Maximum.
Continue reading “Possible Ancient River System Discovered off Wilmington, North Carolina”A look back at 2023 and the Office of Coast Survey’s significant activities throughout the year
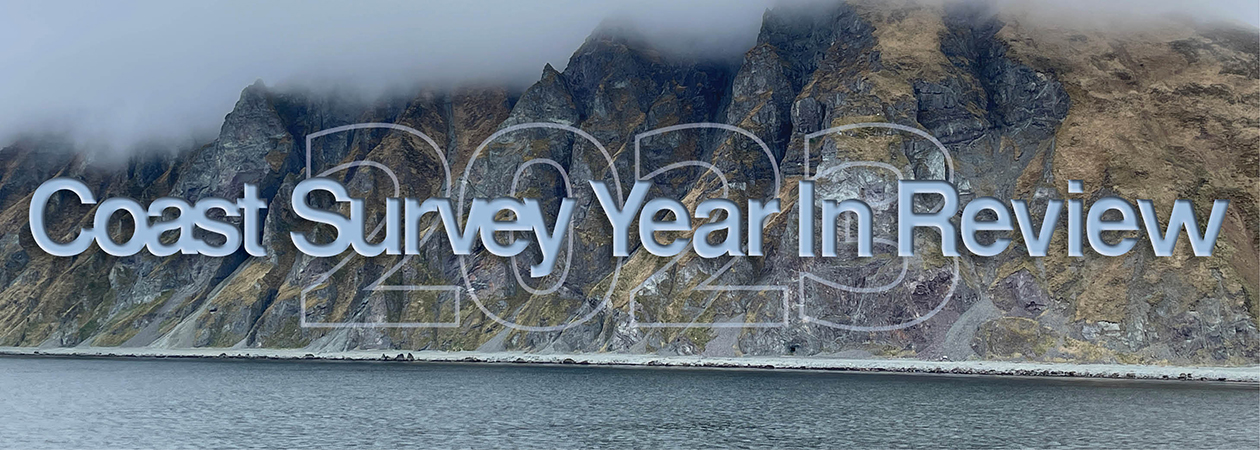
NOAA’s Office of Coast Survey is reflecting on a successful and remarkable 2023! We completed many significant activities with meaningful impacts. As we look ahead to more progress in 2024, we are proud to share some highlights of the past year in our Coast Survey Year in Review ArcGIS StoryMap.
Continue reading “A look back at 2023 and the Office of Coast Survey’s significant activities throughout the year”Bringing nautical charts of the Erie Canal into the digital era
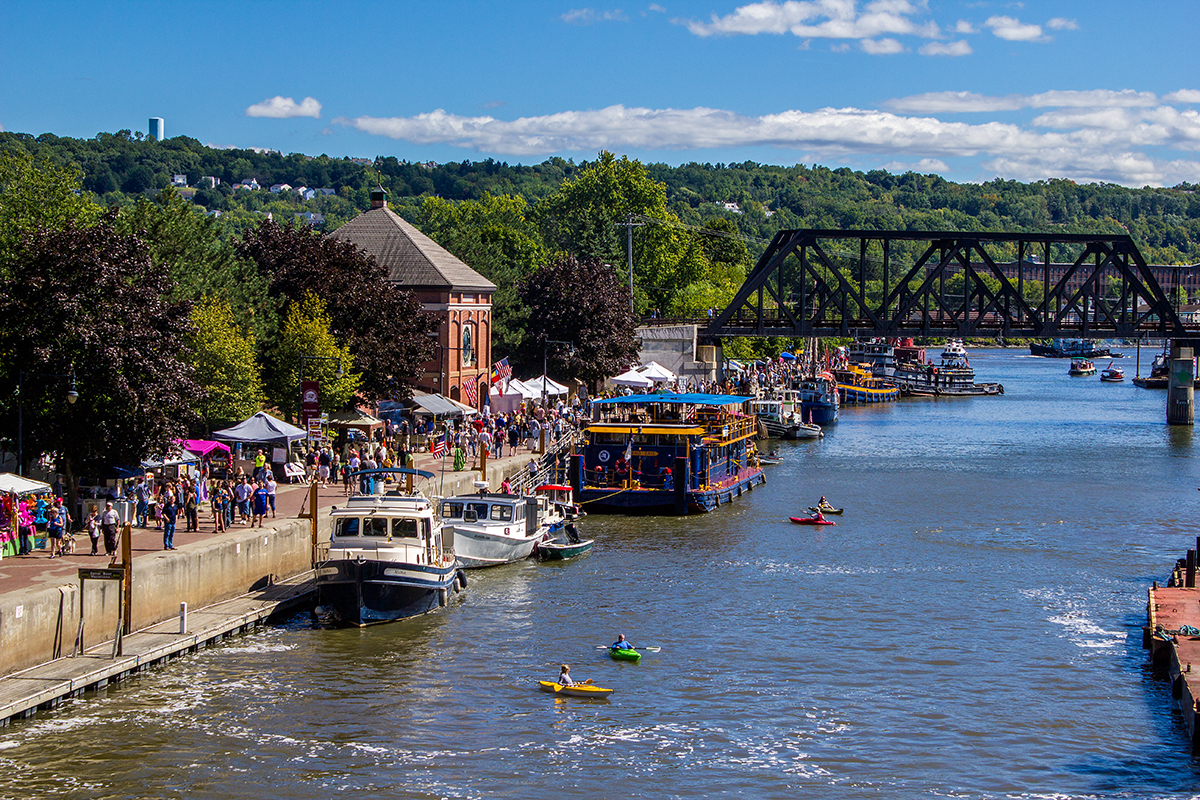
The construction of the Erie Canal was one of 19th Century America’s most significant feats of engineering. Built between 1817 and 1825, the canal provided a water route from Albany to Buffalo, New York, nearly 363 miles to the west. The Canal connected the Hudson River with the Great Lakes via parts of the Mohawk River, through various land cuts and natural lakes. The New York State Public Works Department and the US War Department’s Corps of Engineers began geographically documenting the canal’s route with maps and nautical charts beginning in 1917. The Department of Commerce’s National Oceanic and Atmospheric Administration took ownership of the charts in the early 1970’s and has maintained and updated them for over 50 years. Currently, these charts are undergoing changes to usher them into the digital era of electronic navigational charts.
Check out our digitizing the Erie Canal ArcGIS StoryMap linked here or click the image below!
Surveying the Canadian Arctic aboard the icebreaker Henry Larsen
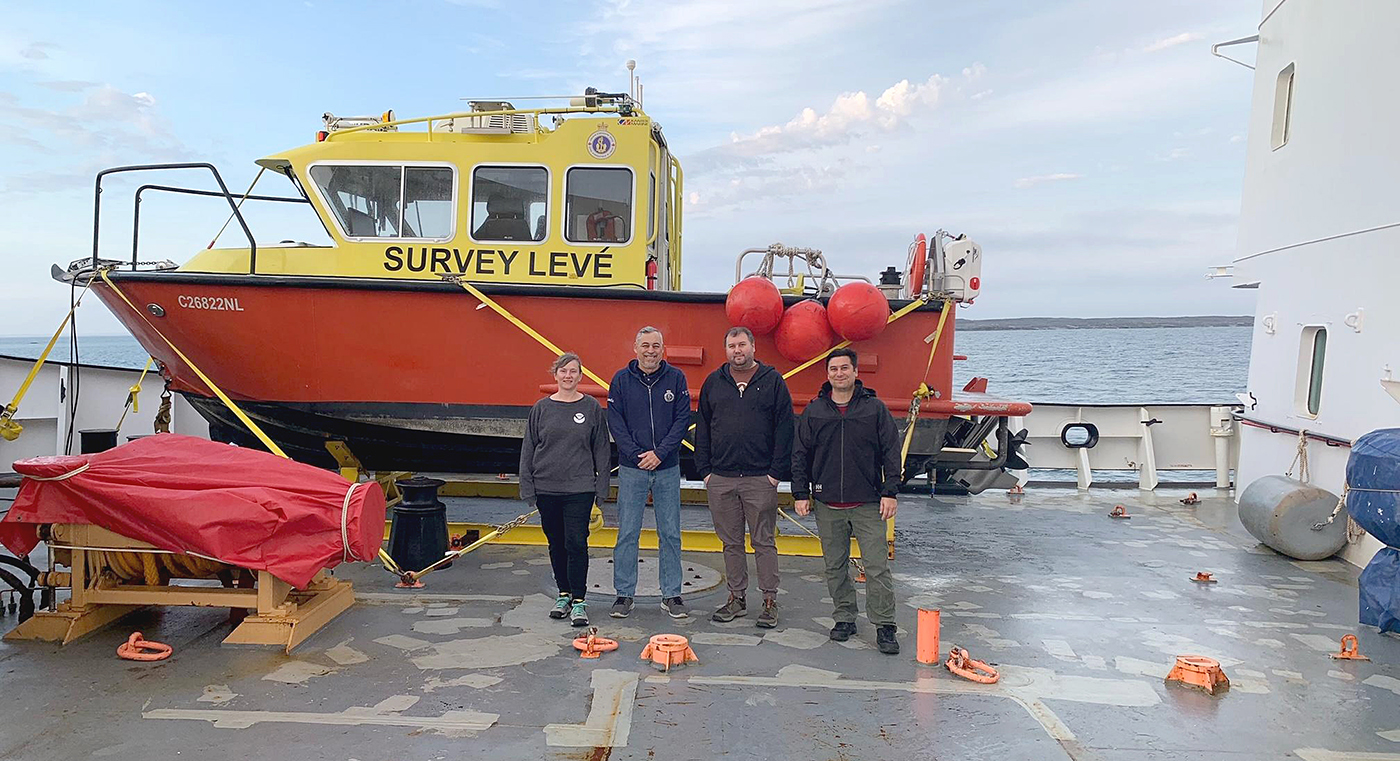
Annie Raymond, a member of one of NOAA’s navigation response teams, spent time in late summer aboard Canadian Coast Guard (CCG) icebreaker Henry Larsen in the Canadian Arctic with the Canadian Hydrographic Service (CHS). Her time aboard the ship was part of an exchange program designed as an opportunity for the Office of Coast Survey and CHS to gain exposure to each other’s field operations, particularly highlighting challenges for Arctic operations. Throughout the experience, she observed similarities and differences between Coast Survey and CHS data acquisitions and operations.
Continue reading “Surveying the Canadian Arctic aboard the icebreaker Henry Larsen”NOAA contributes to Empowering Women in Hydrography through at-sea experience, part 6
The Empowering Women in Hydrography project is a global effort led by the International Hydrographic Organization and Canada that seeks to initiate, organize and track a series of activities and initiatives which will enable more women to participate equitably in the field of hydrography and to assume leadership roles within the hydrographic community. NOAA is contributing to the project via an ‘at-sea experience’ on NOAA hydrographic ships for three women each year over the lifespan of the project. After a global call for nominations, three women were selected to join NOAA ships for the 2023 survey season. Lt. Lucía Cattana, from the Argentine Naval Hydrography Service, joined NOAA Ship Nancy Foster from 5 to 10 July 2023, while conducting surveys off the coast of South Carolina.
Continue reading “NOAA contributes to Empowering Women in Hydrography through at-sea experience, part 6”NOAA’s updated hydrographic survey specifications now available for public comment
A draft of the new Hydrographic Survey Specifications and Deliverables document from NOAA’s Office of Coast Survey is now posted to the Federal Register, where it will be available for public comment until October 12, 2023. All interested parties are encouraged to review the draft and provide feedback via the instructions provided in the Federal Register Notice.
Continue reading “NOAA’s updated hydrographic survey specifications now available for public comment”Surveying the Pribilof Islands, from Pathfinder to Fairweather
By Lt. Taylor Krabiel
In the 1950s, U.S. Coast and Geodetic Survey (USC&GS) Pathfinder surveyed the Pribilof Islands with the latest technologies to chart previously unsurveyed waters and bring the islands into a common datum with the mainland. Fast forward 71 years and NOAA Ship Fairweather continues this work. Despite the decades and technologies that separate the two ships, they share many commonalities in their mission and their surveying techniques.
Continue reading “Surveying the Pribilof Islands, from Pathfinder to Fairweather”