 An
official website of the United States government.
Here's how you know we're official.
An
official website of the United States government.
Here's how you know we're official.
An
official website of the United States government.
Here's how you know we're official.
An
official website of the United States government.
Here's how you know we're official.
Rescheming NOAA ENCs is underway. What does that mean?
The arrangement or layout of a set of charts is called a scheme — a systematic configuration of chart "footprints." NOAA is creating a new gridded layout of rectangularly shaped charts for its electronic navigational chart (NOAA ENC®) product suite.
In the early 1990s, NOAA began digitizing paper nautical charts to create a new digital chart product, the electronic navigational chart. The scale and limits of each ENC chart, also known as a cell, were inherited directly from its corresponding paper chart. The resulting NOAA ENC product suite consisted of over 1200 irregularly shaped cells, compiled in over 100 scales.
Below, the original layout of the "approach scale" NOAA ENCs in the Great Lakes is shown in red. The new gridded scheme for the same coverage is shown in blue.
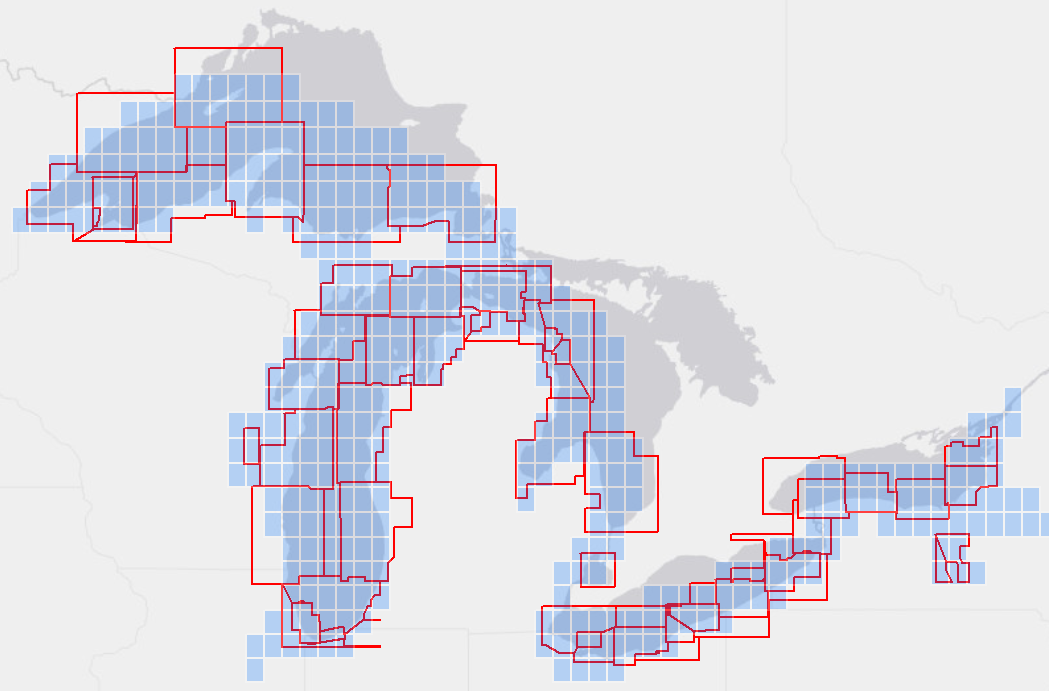 Comparison of old and reschemed NOAA ENC coverage over the
Great
Lakes
Comparison of old and reschemed NOAA ENC coverage over the
Great
Lakes
The new scheme for all NOAA ENCs may be seen on the Status of New NOAA ENCs webmap, which also shows the ongoing progress of creating reschemed ENCs.
Why is NOAA focusing efforts on improving the NOAA ENCs?
There is a growing need for ever more detailed nautical charts. This is driven by several factors including, larger ships entering ports and transiting channels with the tightest of under keel clearances — requiring more precise depth information, the greater adoption of (in some cases, the requirement for) use of digital charts, electronic navigational systems, and GPS — requiring greater positional accuracy.
Since July 2018, the International Maritime Organization (IMO) has required nearly all commercial ships on international voyages to use an Electronic Chart Display and Information System, or ECDIS and ENCs. This is specified in the International Convention for the Safety of Life at Sea, or SOLAS, Chapter V, Regulation 19, "Carriage requirements for shipborne navigational systems and equipment". ECDIS is a sophisticated navigation system that is integrated with other ship equipment and sensors, such as GPS, gyroscopes, and sometimes radar.
In 2016, the U.S. Coast Guard published Vessel Inspection Circular No. 01-16 (NVIC 01-16). This announced that commercial ships on domestic voyages within U.S. waters may now use ENCs in lieu of paper nautical charts.
Recreational boaters are also making greater use of ENCs and developers of navigation and chart display systems have responded by making ENC compatible equipment available to a broader community of users.
Reschemed ENC design
ENC usage bands and standard scales
Paper nautical charts and ENCs are created at various scales for different navigational purposes. The smallest scale (least detailed) "overview" charts are used for basic voyage planning. The largest scale (most detailed) "harbor" and "berthing" charts are used for navigating into a harbor and maneuvering to a pier or wharf. ENCs are categorized into six usage bands, sometimes called scale bands.
The original NOAA design for reschemed ENCs established a set of 12 standard compilation scales, two for each usage band. The International Hydrographic Organization, or IHO, finalized the standard minimum and maximum display scales defined in the new S-101 ENC Product Specification and these are slightly different than the scales initially used for NOAA ENC rescheming. NOAA ENCs, all of which are currently in the old IHO S-57 ENC format, are being transitioned to the new S-101 scales in preparation for production of both ENC formats (S-57 and S-101) that will start in 2026. The new S-101 scales that will be used for reschemed ENCs are shown in the table below, along with the scale ranges used for legacy ENCs that have not yet been reschemed.
| ENC Usage Band | Navigational Purpose | Legacy NOAA ENC Scale Ranges | Reschemed NOAA ENC Scales |
| 1 | Overview | 1:587,870 - 10,000,000 |
1:10,000,000 1:3,500,000 |
| 2 | General | 1:240,000 - 1:1,534,076 |
1:1,500,000 1:700,000 |
| 3 | Coastal | 1:150,000 - 1:600,000 |
1:350,000 1:180,000 |
| 4 | Approach | 1:25,000 - 1:150,000 |
1:90,000 1:45,000 |
| 5 | Harbor | 1:5,000 - 51,639 |
1:22,000 1:12,000 |
| 6 | Berthing | 1:2,500 - 12,000 | 1:4,000 1:2,000 |
The new ENC layout consists of nested cells whose boundaries follow lines of longitude and latitude. Sixteen larger scale ENC cells fit inside one cell of the next smaller scale band. The figure below shows how 16 band 3 cells (green squares) fit inside one band 2 cell (brown) and the relative sizes of the other bands.
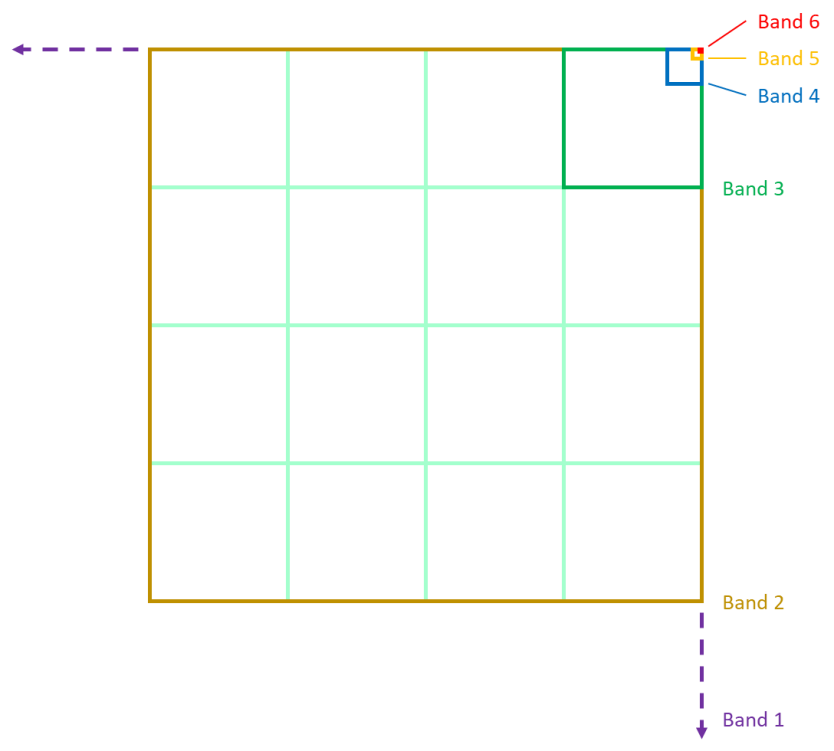 Nesting of reschemed ENC cells
On the globe, lines of longitude, also called meridians, converge at the Poles. Thus, the area of the Earth covered by ENC cells defined by equal extents of latitude and longitude will be narrower for ENCs further away from the Equator. Reschemed ENC cells take this narrowing into account. Cells closer to the poles are widened by increasing their longitudinal extent as a multiple of their height.
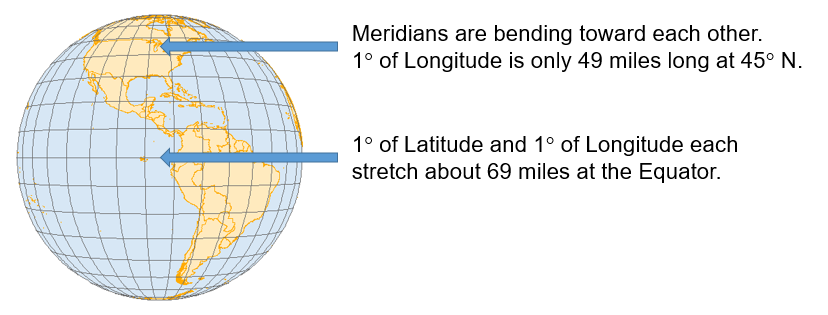 Distance between meridians decreases as they converge at the
poles
Distance between meridians decreases as they converge at the
poles
Thus, ENCs are wider longitudinally as they get further from the poles, so the extent of the coverage "on the ground" doesn't get too narrow.
The width of reschemed ENCs is determined by its location within three zones of latitude. There are three standard widths that apply to bands 3 through 6, detailed below. The zones for bands 1 and 2 are determined by a different method.
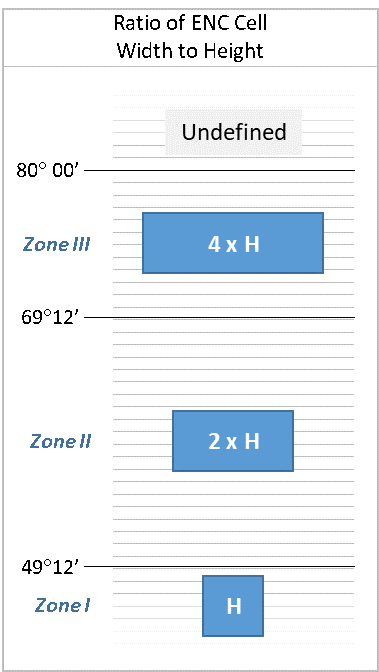
The table below shows cell widths, for each zone, for each usage band, in decimal degrees of longitude. Cell dimensions are the same for both of the two standard scales in each usage band. For example, the height of all band 3 ENC cells is 1.2° in latitude. Band 3 cells below 49° 12' N fall into Zone I and have a cell width equal to their height. Thus, band 3 cells in Zone I have a width of 1.2° in longitude. Band 3 cells falling between 49° 12' N and 69° 12' N are in Zone II and have a width of twice their height, or 2.4° in longitude. The width of cells falling in Zone III is four times their height, or 4.8° in longitude.
| Usage Band | Navigational Purpose |
Compilation Scales |
Height |
Zone I Width = H |
Zone II Width = 2xH |
Zone III Width = 4xH |
| 1 | Overview |
1:10,000,000 1:3,500,000 |
19.2° | 19.2° | 38.4° | 76.8° |
| 2 | General |
1:1,500,000 1:700,000 |
4.8° | 4.8° | 9.6° | 19.2° |
| 3 | Coastal |
1:350,000 1:180,000 |
1.2° | 1.2° | 2.4° | 4.8° |
| 4 | Approach |
1:90,000 1:45,000 |
0.3° | 0.3° | 0.6° | 1.2° |
| 5 | Harbor |
1:22,000 1:12,000 |
0.075° | 0.075° | 0.15° | 0.3° |
| 6 | Berthing | 1:4,000 1:2,000 |
0.0375° | 0.0375° | 0.075° | 0.15° |
For band 2 ENCs, all cells with the contiguous 48 states are considered to be in zone I. Band 2 ENCs west of Washington State in the North Pacific are considered to be in zone II, except for ENCs in Alaska covering Point Hope, the North Slope and the Artic Sea, which are considered Zone III. Band 1 ENCs will be some of the last cells created as part of the rescheming effort. The placement of individual band 1 cells within specific width zones has not yet been established.
Enhancements implemented in new ENCs
As new gridded ENCs are created, a number of improvements to the quality and consistency of the data are being implemented.
Larger, standard scale coverageSome paper charts and the associated ENCs were compiled at scales that happen to match one of the standard scales used for reschemed ENCs. In these cases the new, reschemed cells generally retain the scale used in the old scheme.
If coverage in the original ENC scheme was not compiled at a standard rescheme scale, then the reschemed cells are usually "bumped up" to the next larger scale.
The use of fewer chart scales for reschemed ENCs also facilitates resolving discontinuities and properly "edge-matching" data between adjacent ENC cells.
Standardized metric depth contoursWhen NOAA digitized paper charts to create the first NOAA ENCs, depth values for soundings, depth curves, and other features with depths were converted from the fathoms and feet shown on the charts to meters in order to populate the ENC database. The ENC product specification established by the International Hydrographic Organization requires depths to be stored as metric values. However, the depth contours continued to reflect the intervals in which they were compiled. Thus, depth contours of older ENC data displayed in meters will show fractional metric values resulting from the unit conversion from feet to meters, as shown in the image below.
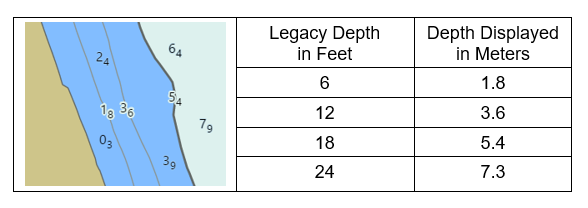
When the ENC rescheming project is completed, all depth contours will be compiled in whole metric units. However, some newly reschemed ENC cells will not be recompiled in their initial release (first edition) of the cell. The image below shows examples of whole 2, 5, 10, 20, and 50 meter depth contours. The depth value of soundings will also be stored and displayed with a higher degree of precision than available on paper charts. Soundings less than 30 meters deep are stored and displayed as meters with subscripts in tenths of meters (decimeters) - a granularity smaller than 4 inches.
 Depiction of metric ENC depth contours
The table below shows the standard depth contours that may be used in reschemed ENCs for each usage band. Intervals used for any particular ENC will be based on the relief found within that cell. For larger scale ENCs, depth contours for 3, 4, 6, 7, and 8 meters will only be compiled in areas with a gently sloping bottom. In areas with extremely steep bathymetry, the 2 and 5 meter contours may also be omitted.
 New Standard Metric Depth Contour Intervals
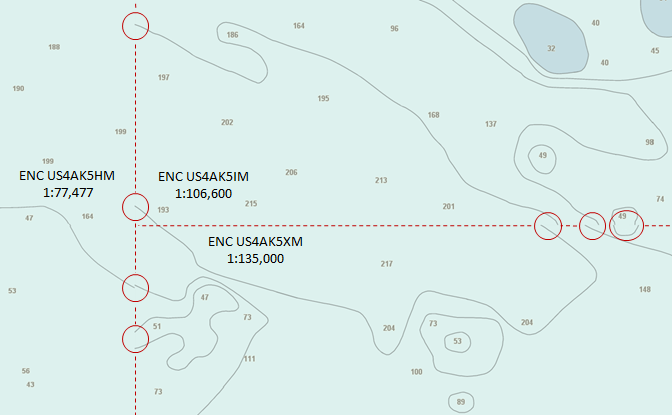
The legacy of the original papner charts from which ENC data was digitized lives on in the current suite of ENCs. Adjacent paper charts, even those having the same navigational purpose (harbor, approach, coastal, etc.) are often compiled at different scales to accommodate different paper orientations and sizes, or a desire to "stretch" coverage to include harbors or other features at either side of a chart. Different depth contour intervals are often used on different scale charts, and the techniques for "edge matching" adjacent ENC cells of different scales can be challenging. The figure below highlights discontinuities on three adjacent ENC cells. Not only do depth contour intervals sometimes change between adjacent cells, depth contours of the same value, compiled separately, and at a different scale, sometimes do not match.
As new ENC cells are created for the gridded layout they will be recompiled with standard depth contour intervals that match across ENC cell boundaries within the same standard scale. Similar alignment errors among other features, such as shoreline, will also be resolved as new ENC cells are created.
ENC rescheming schedule
When compiling data for several different scale charts, best cartographic practices include compiling source data through the scales, beginning with the largest. This large scale compilation is then generalized for the next smaller scale map or chart and the generalization process is repeated for successively smaller scale coverage. This technique is applicable to both traditional paper and raster chart compilations as well as for ENCs. Thus, the general plan for the ENC rescheming schedule is focused on creating band 5 ENCs along the coasts first, followed by the next smaller scale, band 4 cells, then band 3, etc. There may be exceptions to this general strategy, based on the scale of the existing ENC coverage, the availability of source data, and other factors.
The progress of ENC rescheming can be tracked on the Status of New NOAA ENCs webmap. Blue rectangles show planned ENC footprints, red are ENCs in work, yellow are cells in review, and green are newly gridded, standard scale ENCs that that are available to the public. Other ENC improvements, such as the metrification of depths, and addition of topographic contours and transportation networks may not yet be present.