 An
official website of the United States government.
Here's how you know we're official.
An
official website of the United States government.
Here's how you know we're official.
An
official website of the United States government.
Here's how you know we're official.
An
official website of the United States government.
Here's how you know we're official.
BlueTopo™ Specifications
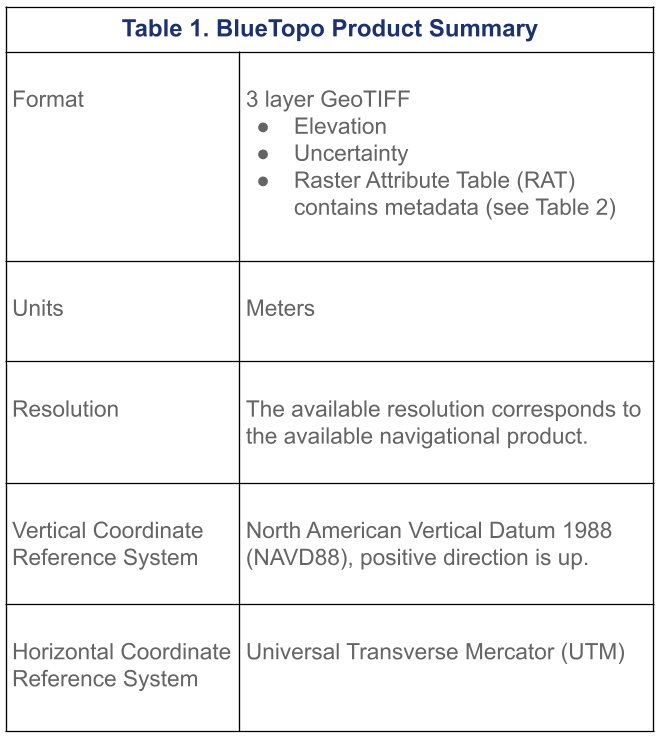
BlueTopo is available for download as three layer GeoTIFFs with elevation, uncertainty, and raster attribute table (RAT) layers. All layers are presented as 32-bit floating point values. See FAQ for information on how to download the GeoTIFFS
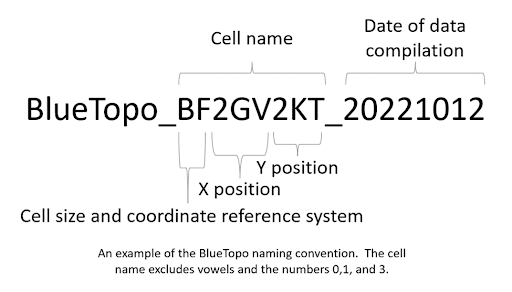
The current naming convention for BlueTopo is a combination of several worldwide schemes with different cell sizes. A definition of the current tile names and a link to the data can be found in a geopackage in the BlueTopo bucket on AWS. We expect to update the tessellation scheme and the associated naming convention in the future, but this file will be kept up to date with the latest tiles available. Depending on region, you can expect to see new BlueTopo files with the latest data, weekly to monthly. The nowCOAST map viewer makes BlueTopo available through a web map tile service and the viewer.
GeoTIFF Image Description Tag: The TIFF format allows for tags that provide additional metadata. Within the tag "TIFFTAG_IMAGEDESCRIPTION" we have the following text.
These data are not for navigation; please see the NOAA's Electronic Navigational Charts site to access navigational products.
This dataset is a multi-layered raster and part of NOAA Office of Coast Survey BlueTopo bathymetry. This product may include preliminary and unqualified information and as such may contain position and depth errors and/or other quality issues. Products generated with these data are not to be used for measurements or navigation. Furthermore, BlueTopo is not on a navigational vertical datum.
The user assumes the entire risk related to the use of these products. NOAA Office of Coast Survey (OCS) is providing these products "as-is" and Office of Coast Survey disclaims any and all warranties, whether express or implied, including any implied warranties of merchantability or fitness for a particular purpose. In no event will the Office of Coast Survey be liable to you or any third party for any direct, indirect, incidental, consequential, special, or exemplary damages or lost profit resulting from any use or misuse of these data.
The bathymetry is compiled from multiple sources with varying quality and includes forms of interpolation. The bathymetric quality and interpolation is described through the vertical uncertainty layer and the associated data quality raster attribute table.
When using this National Bathymetric Source (NBS) product in publications and presentations please acknowledge that data used in this project/study was derived from NOAA Office of Coast Survey BlueTopo product.
The vertical coordinate reference system for this product is NAVD88 and is further described in the private GDAL_METADATA TIFF tag as VERTICALDATUMWKT.
For further information please contact ocs.nbs@noaa.gov
Elevation layer description: Elevation values are increasingly negative with increasing water depth, values landward of the specified vertical datum are positive. The vertical datum is North American Vertical Datum 1988 (NAVD88). Elevation values present in BlueTopo come from several different sources, identified in the RAT (third layer of the geotiff, see Table 2). The elevation layer consists of both measured bathymetry data and interpolated values. Some of the interpolated values are supported by other survey methods, such as side scan, and some is strictly a best guess interpolation. If bathy_coverage is true, the value is sourced from a measured depth. If bathy_coverage is false the value is sourced from an interpolated depth. The bathymetry is compiled from multiple sources with varying quality and includes forms of interpolation. Areas of generalization have not been limited by the shoreline, so erroneous interpolation may occur where there is land if no other data are present.
Uncertainty layer description: Uncertainty values are derived from source data according to the equipment that was used and water depth. Uncertainty for interpolated data is derived from the source.
Contributors layer description: The contributors layer contains an index that corresponds to an entry in the associated Raster Attribute Table.
Raster Attribute Table (RAT): The RAT defines where the data came from, the license for use, and some quality metrics that are associated with the International Hydrographic Organization S-101 Quality of Bathymetric Data. The RAT will be updated to suit S-102 once it is finalized. Table 2 describes the metadata included in the raster attribute tables in more detail. The no data value is NAN.
| Acronym | Name | Description | Value |
|---|---|---|---|
| value | Value | A list of each unique cell value in the raster dataset. | Float |
| count | Count | The number of cells in the raster dataset with the cell value in the VALUE column. | Float |
| data_assessment | Data Assessment | Provides an overall indicative level of assessment of bathymetric data from which further attribution is derived. | Unsigned Integer 1 = assessed 3 = unassessed |
| significant_features | Significant Features Detected |
A binary indication that a systematic method of exploring the seafloor was undertaken to detect significant features. If false, feature_size and feature_least_depth attributes are both not applicable. In the context of bathymetry, a feature is any object, whether manmade or not, projecting above the seafloor, which may be considered a danger to surface navigation. |
Boolean 1 = True 0 = False |
| feature_least_depth | Least Depth of Detected Features Measured | A binary expression of the ability of the survey to detect the least depth of features. | Boolean 1 = True 0 = False |
| feature_size | Size of Features Detected | The size of the smallest feature that the survey was capable of detecting with a high probability - unit is cubic meters. | Float |
| coverage | Full Seafloor Coverage Achieved | A binary statement expressing if seafloor coverage has been achieved in the area covered by hydrographic surveys. If false, the bathy_coverage attribute must also be false. If true, bathy_coverage may either be true or false. For information, see the FAQ page. | Boolean 1 = True 0 = False |
| bathy_coverage | Full Bathymetric Coverage Achieved | A binary expression stating if full bathymetric coverage has been achieved in the area covered by hydrographic surveys. If true, this indicates the value is sourced from a measured depth, not an interpolated depth. If false, no depth measurement was achieved. | Boolean 1 = True 0 = False |
| horizontal_uncert_fixed | Horizontal Uncertainty Fixed | The best estimate of the fixed accuracy of a position. Reported at a 95% Confidence Interval. | Float |
| horizontal_uncert_var | Horizontal Uncertainty Variable | The best estimate of the variable accuracy of a position as a multiplier of depth. Reported at a 95% Confidence Interval. | Float |
| vertical_uncert_fixed | Vertical Uncertainty Fixed | The best estimate of the accuracy of depths, heights, vertical distances and vertical clearances. Reported at a 95% Confidence Interval. | Float |
| vertical_uncert_var | Vertical Uncertainty Variable | The best estimate of the variable accuracy of depths, heights, vertical distances and vertical clearances. Reported at a 95% Confidence Interval. | Float |
| license_name | License Name | The license information regarding restrictions on data redistribution, usage, and source attribution. | String |
| license_url | License URL or DOI | The URL or DOI where the license is available. | String |
| source_survey_id | Source Survey ID | The survey filename. | String |
| source_institution | Source Institution | The institution responsible for the survey. | String |
| survey_date_start | Survey Start Date | The start date of the survey. | String ISO 8601:2004 |
| survey_date_end | Survey End Date | The end date of the survey. | String ISO 8601:2004 |