 An
official website of the United States government.
Here's how you know we're official.
An
official website of the United States government.
Here's how you know we're official.
An
official website of the United States government.
Here's how you know we're official.
An
official website of the United States government.
Here's how you know we're official.
BlueTopo™ Frequently Asked Questions (FAQs)
Why isn't there any data in my area?
BlueTopo is still under development for many parts of the nation. Areas are prioritized for work based on navigation significance and risk.
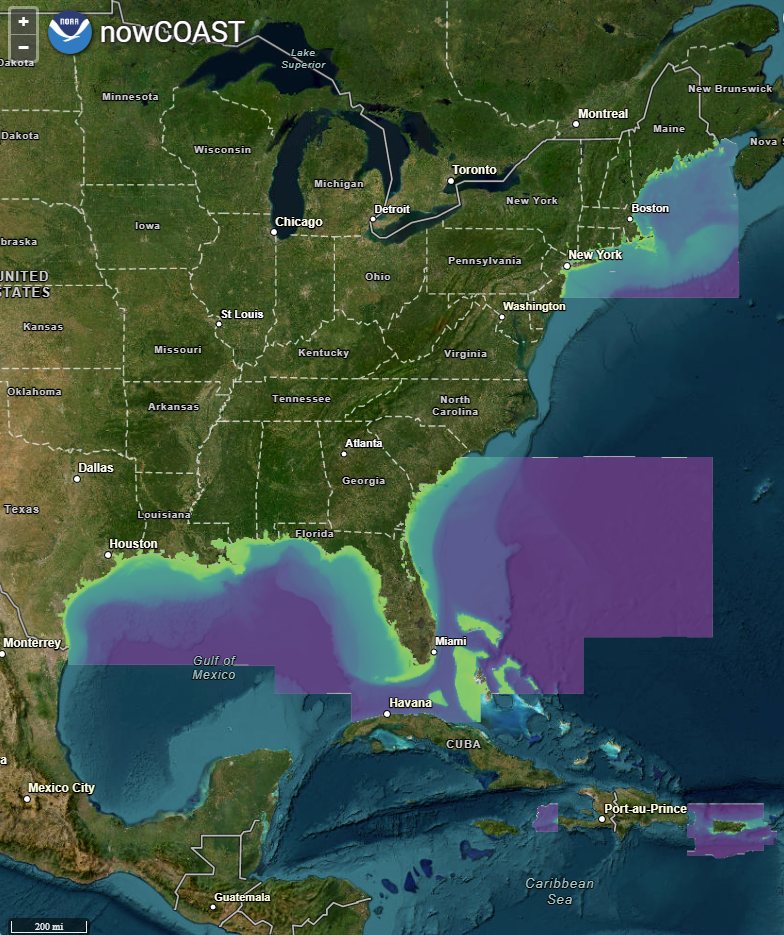
Where is there data now?
The Gulf Coast, Atlantic Coast, and U.S. Caribbean regions are completed, with a plan to release new regions approximately every six months.
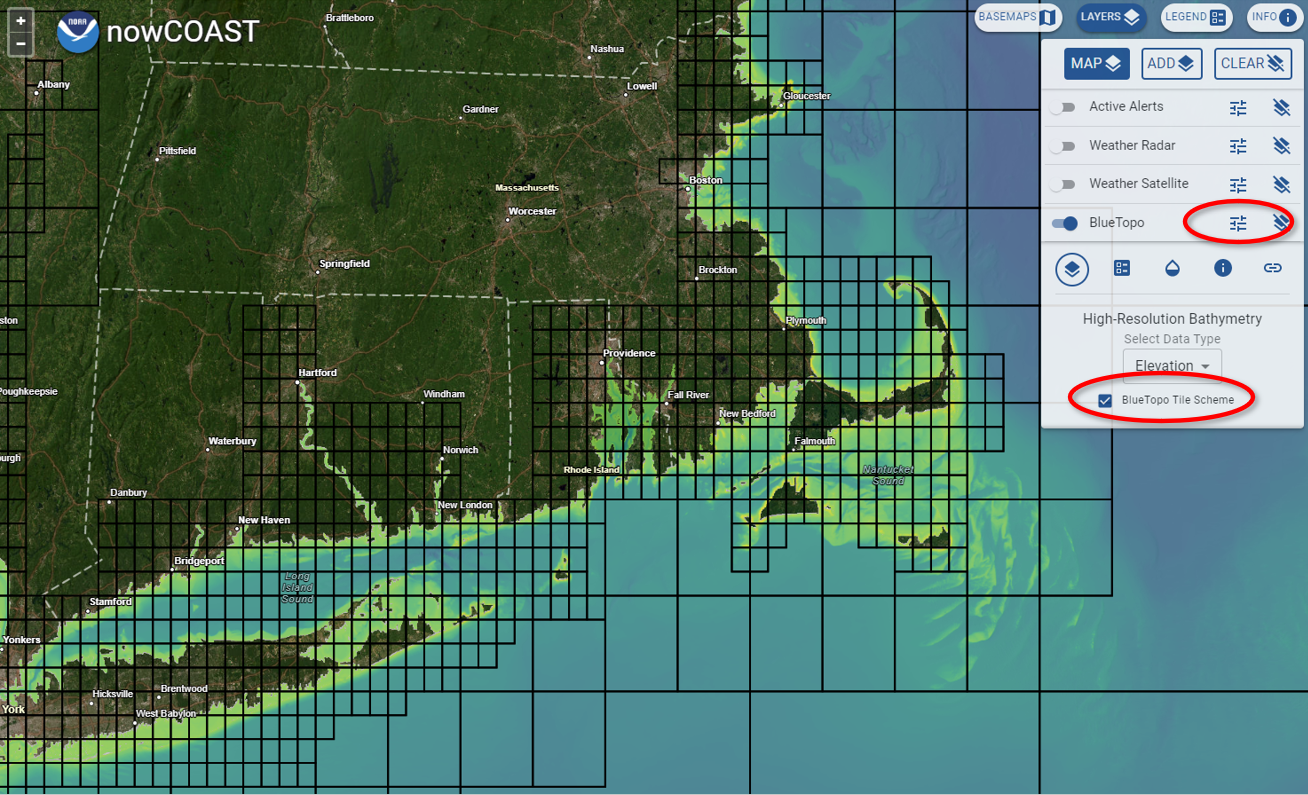
How do I know which tile is in my area of interest?
The current naming convention for the files is made up of a tile name and the date the file was created. There is a dated BlueTopo_Tile_Scheme geopackage located in the National Bathymety NOAA Open Data Dissemination Program Program AWS bucket to aid in identifying tiles of interest. This BlueTopo Tile Scheme can also be viewed in nowCOAST by selecting the layer on the map.
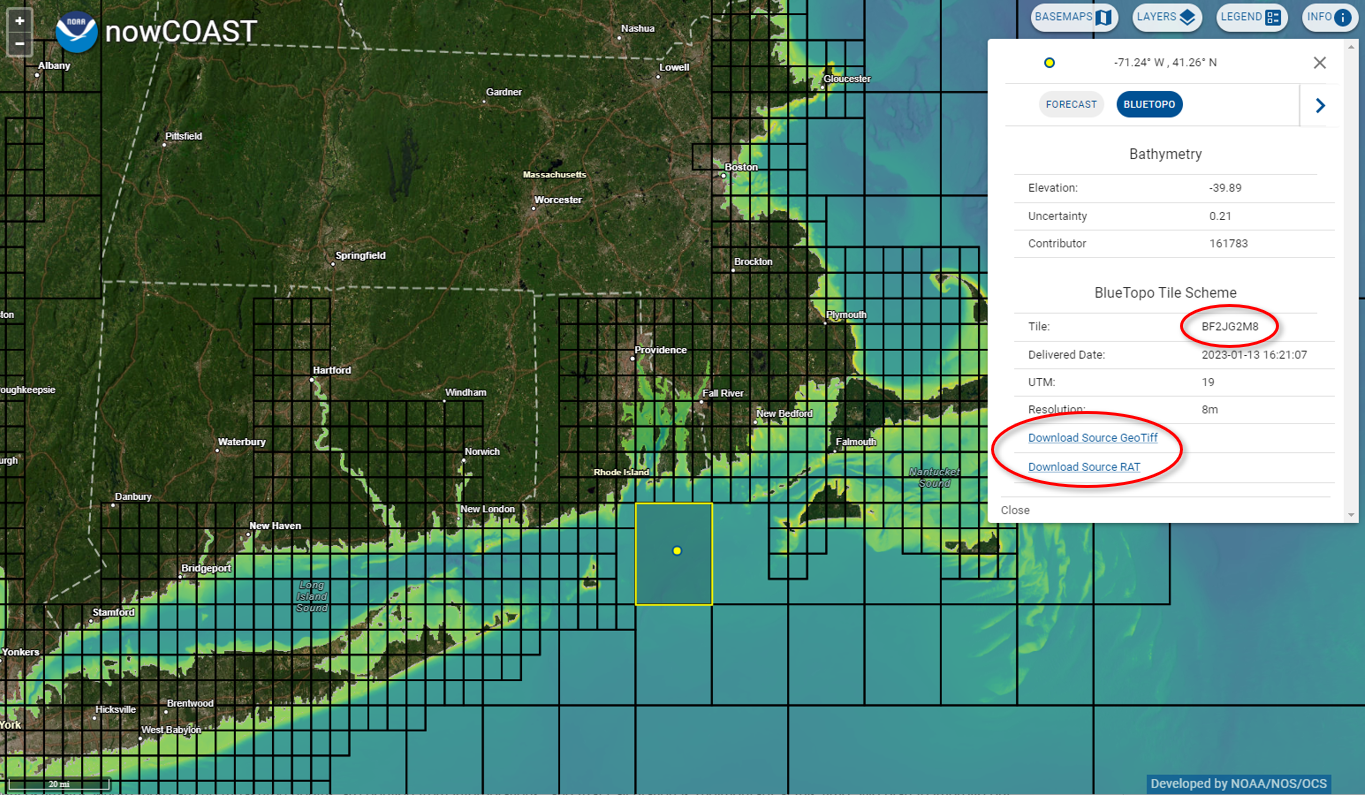
If you select a tile, it will identify the tile name and provide the links to the GeoTIFF and Raster Attribute Table
How do I access BlueTopo data?
BlueTopo is accessable through several means. nowCOAST provides a webviewer, web services (WMTS), and also provides a link to specific tiles for download from AWS as described above. Downloading many BlueTopo tiles may be done more efficiently using the utilities described below. BlueTopo is hosted for public access through the NOAA Open Data Dissemination Program National Bathymetry AWS bucket.
Access BlueTopo through AWS:
BlueTopo is available to download through NOAA's Open Data Dissemination Program at Amazon Web Services bucket at https://registry.opendata.aws/noaa-bathymetry/.
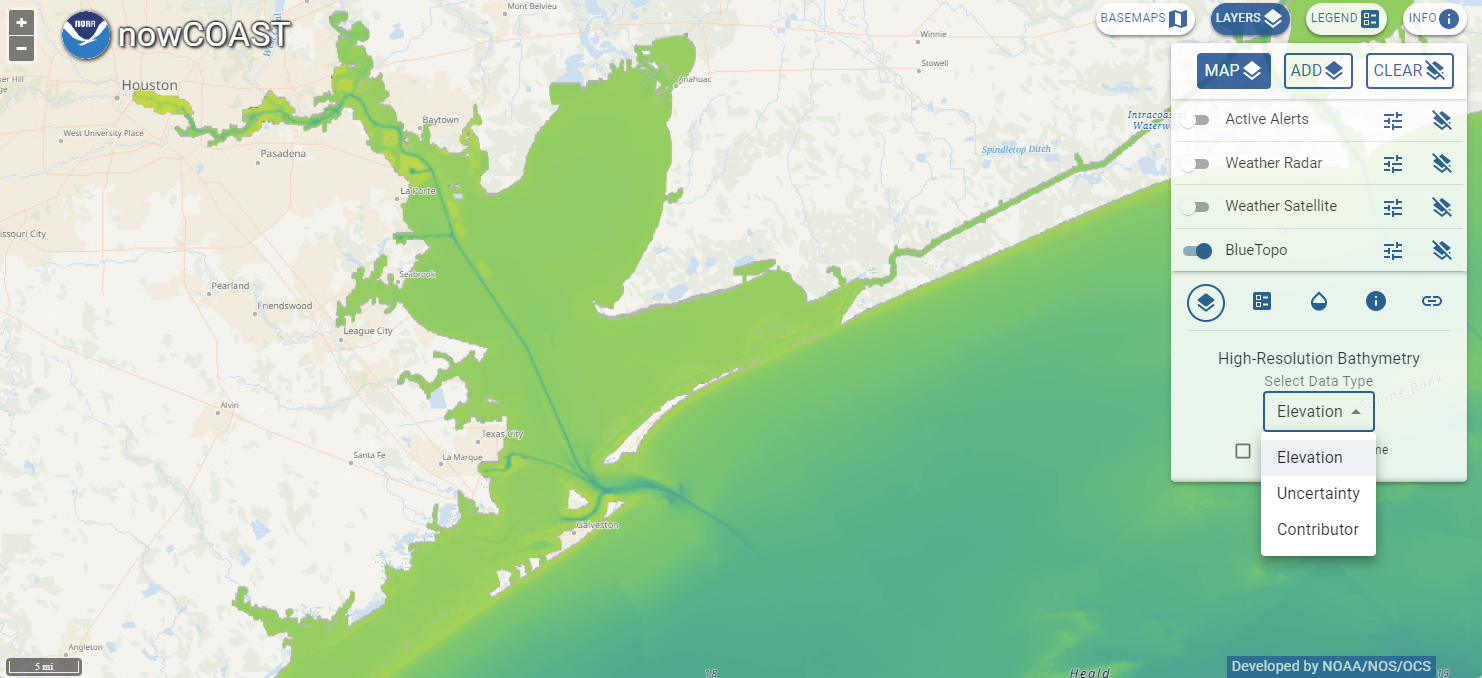
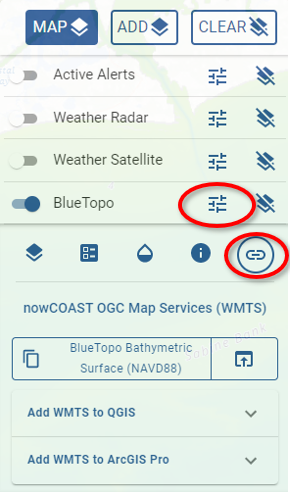
Access BlueTopo through nowCOAST:
BlueTopo Elevation, Uncertainty, and Contributor layers are available to view on nowCOAST™. GeoTiffs and Raster Attribute Tables (RATs) for individual tiles may also be downloaded directly from nowCOAST™.
Access BlueTopo through test and evaluation utilities:
For GIS savvy users that have a polygon describing an area of interest, we provide a Windows executable or python script on GitHub that may facilitate downloading and maintaining an up to date local cache of BlueTopo tiles.
The BlueTopo products can also be accessed through a web map tile service (WMTS). nowCOAST™ provides instructions on how to add the WMTS to QGIS and ArcGIS Pro.
Is there an API for accessing BlueTopo data?
BlueTopo is available through web services from nowCOAST™
What data sources are used to produce BlueTopo?
Primary sources of bathymetry include NOAA and U.S. Army Corps of Engineers hydrographic surveys and topographic bathymetric (topo-bathy) LiDAR (light detection and ranging) data. Data submitted through the NOAA Office of Coast Survey's external source data process (contact esd.team@noaa.gov) are also included. Gaps in water greater than 200 meters are filled through Global Multi-Resolution Topography, a merged model of bathymetry.
The GeoTIFF contributors layer and associated raster attribute table identifies the contributing sources and their metadata.
Are there any costs or restrictions to using BlueTopo data?
BlueTopo is free and in the U.S. public domain. There are no restrictions on the BlueTopo products though we appreciate the acknowledgement back to NOAA Coast Survey when using these products.
The GeoTIFF contributors layer and associated raster attribute table identifies the contributing sources metadata, including the data license information regarding restrictions on source data redistribution, usage, and source attribution.
How should I cite BlueTopo data?
When using this National Bathymetric Source (NBS) product in publications and presentations please acknowledge that data used in this project/study was derived from NOAA Office of Coast Survey BlueTopo product.
How can I submit a question or report issues regarding BlueTopo products?
For general questions or feedback about the data, please submit inquiries through the NOAA Office of Coast Survey (OCS) ASSIST Tool.
How do I only look at the source data and remove the interpolated data?
BlueTopo contains several types of interpolation which can be differentiated by the coverage flags in the Contributors layer raster attribute table (RAT).
Areas that are strictly driven by interpolation from the compiled sources will have coverage = 0 (False) and bathymetry_coverage = 0 (False). Removing these sources will result in data that reflects only survey coverage, but will still contain some interpolation at the survey level.
There are two types of survey based interpolation. One that reflects systematic coverage such that the area between data can have an accurate assessment of uncertainty, and another that in addition has feature detection capability. Feature detection capability indicates the area was covered with another sensor such as side scan sonar. Both of these types of coverage will have the RAT attribute bathy_coverage = 0 (False), but areas with side scan sonar will have significant_features = 1 (True).
To remove all interpolated data, both representing survey coverage and from the generalization of the combined data, remove all areas flagged with bathy_coverage = 0 (False).
The uncertainty layer looks weird with lots of really high values. Do all of these uncertainties make sense?
Understanding the quality of the reported bathymetry is best explored using the Uncertainty and Contributor layers. Reasonable vertical uncertainty values are reported with all bathymetry measurements. These values can be identified where the contributor layer bathy_coverage flag is True.
The vertical uncertainty associated with interpolated measurements is a function of distance from the nearest measurement and the dynamic nature of the seafloor (flat vs rough, etc). Estimating the uncertainty associated with interpolated depth measurements is an area of active research. Interpolated depth estimates are any depths that correspond to the bathy_coverage flag is False, but there are different kinds of interpolation as described here.
Interpolated bathymetry uncertainties (bathy_coverage flag is False) that correspond to the contributor layer coverage flag as True depend on the source survey data. If a survey has a significant_features flag as True derive from supporting information, such as side scan sonar, and should be reasonably accurate. If the significant_features flag is False the uncertainty estimates are guesses by an experienced hydrographer but may be optimistic.
Interpolated bathymetry uncertainties (bathy_coverage flag is False) that correspond to the contributor layer coverage flag as False and are generally high. These uncertainty values are driven by a high starting value which is increased by a scaler from the nearest measurement.
Why does the uncertainty fall off instantaneously when moving away from a measured point?
Uncertainty for measured points is dependent on the survey equipment used and depth of water, defined by the International Hydrographic Organization S-101 standards. The uncertainty estimates where there are no measured depths are derived from interpolations, and that calculation is rudimentary at this time. We plan to improve our method of calculating interpolation uncertainty as we continue to develop this product.