 An
official website of the United States government.
Here's how you know we're official.
An
official website of the United States government.
Here's how you know we're official.
An
official website of the United States government.
Here's how you know we're official.
An
official website of the United States government.
Here's how you know we're official.
ENC Direct to GIS displays and allows downloading of NOAA ENC data in a variety of GIS/CAD formats, using web mapping services.
The NOAA ENC data are in International Hydrographic Organization (IHO) S-57 format, which is the data standard for the exchange of digital hydrographic data. Nautical chart features contained within a NOAA ENC provide a detailed representation of the U.S. coastal and marine environment. This data includes coastal topography, bathymetry, landmarks, geographic place names, and marine boundaries. Features in a NOAA ENC are limited in that they only represent the geographic region depicted in that particular ENC. Aggregating nautical features from all NOAA ENCs in the creation of GIS data results in a contiguous depiction of the U.S. coastal and marine environment.
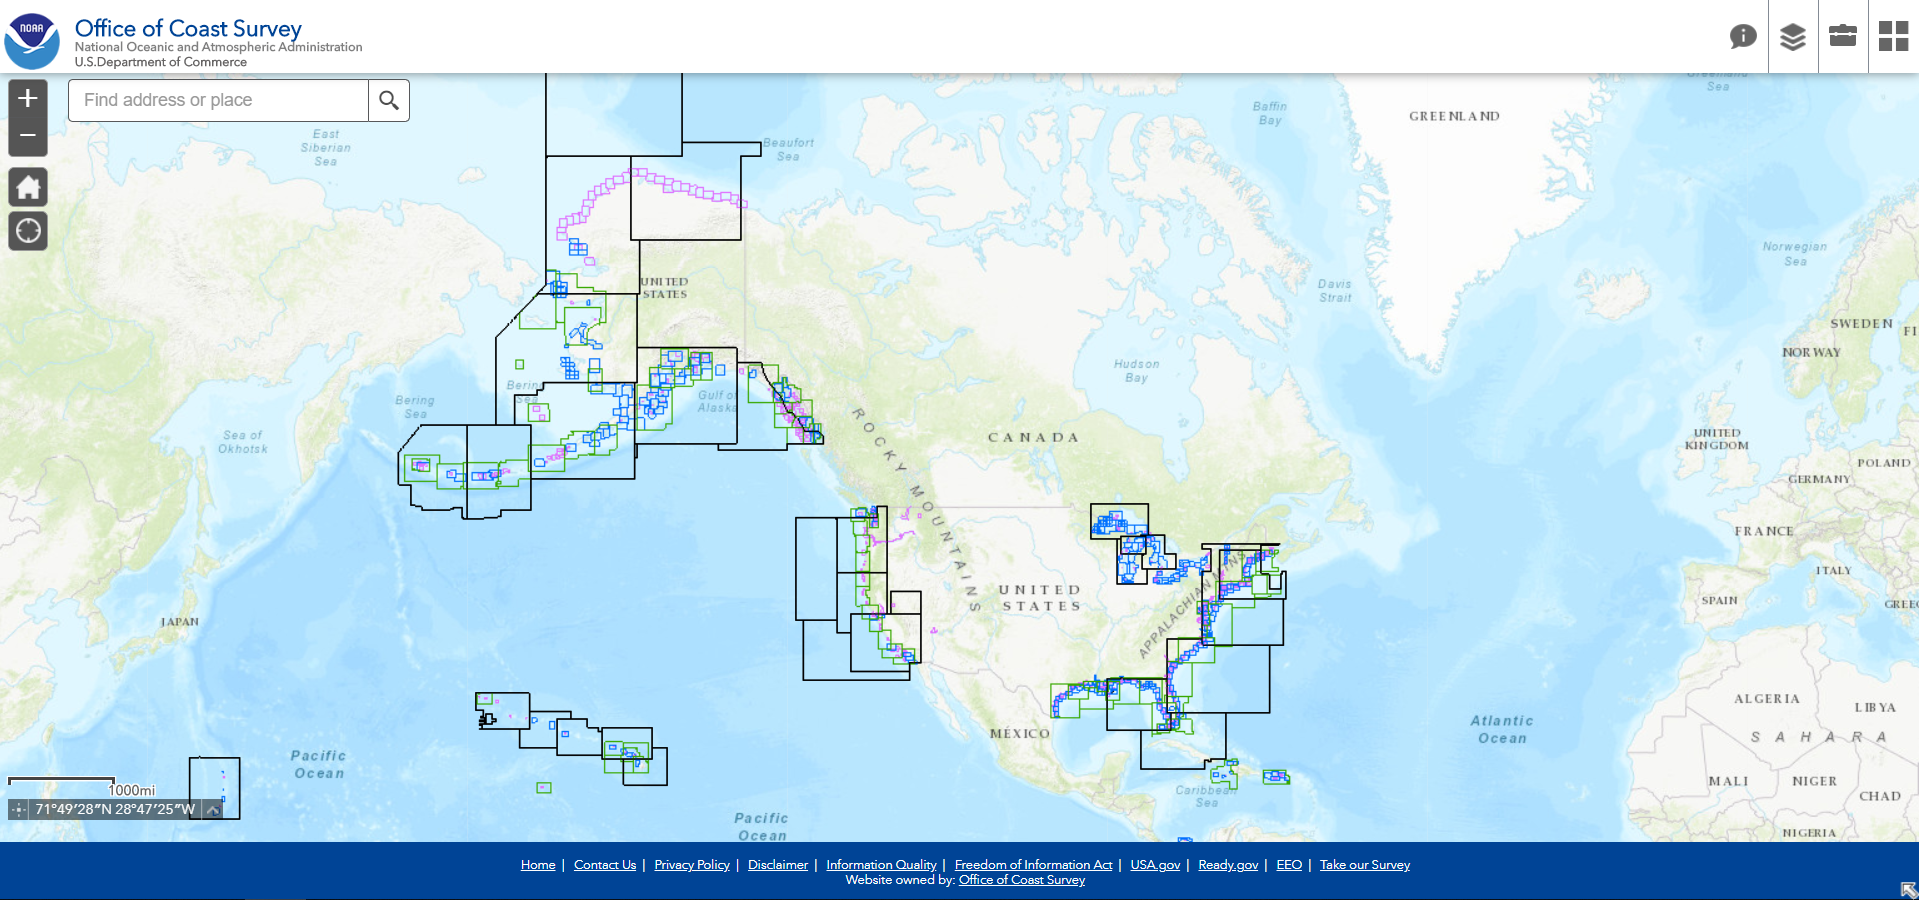 Screenshot of ENC Direct to GIS Application. Note that some data will not display on-screen until you have
zoomed in to the appropriate level. However, when extracting data, all selected data in the scale band will
be extracted whether visible on-screen or not.
Screenshot of ENC Direct to GIS Application. Note that some data will not display on-screen until you have
zoomed in to the appropriate level. However, when extracting data, all selected data in the scale band will
be extracted whether visible on-screen or not. The Default Extent button returns the user to the default extent.
 The My Location button allows the network to detect your physical location and zoom the map to it.
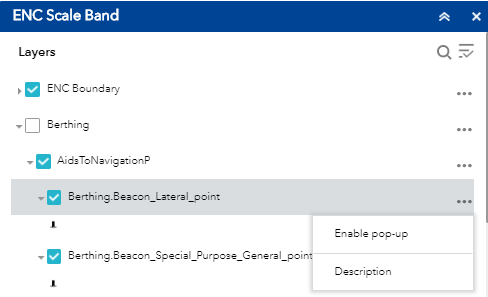
 The ENC Scale Band button located at the top right corner allows users to turn on and off layers at a particular scale band. Clicking the drop down arrow next to the scale band's name provides several functionalities, such as changing dataset transparency or reading about the description of the dataset.
 The Basemap button in the top right corner allows users to overlay the ENC data with several choices of base maps.
 The left side of the screen contains the zoom in and zoom out buttons. This can also be accomplished via mouse wheel. Panning is accomplished via clicking in the map interface in the desired direction.
 The Data Extract button allows users to extract ENC data by scale band. Refer to the "How to Extract ENC data" instructions below for details.
The Data Extract tool allows users to extract ENC data by scale band. The tool doesn't require the data to be visible on the screen. Users can extract data by drawing a polygon on the screen to define the area of interest. The ENC data will be clipped using this user-defined polygon. Users can select various output file formats, such as shapefile (.shp), geodatabase (.gdb), or various CAD file formats.
The Data Extract button allows users to extract ENC data by scale band. Refer to the "How to Extract ENC data" instructions below for details.
The Data Extract tool allows users to extract ENC data by scale band. The tool doesn't require the data to be visible on the screen. Users can extract data by drawing a polygon on the screen to define the area of interest. The ENC data will be clipped using this user-defined polygon. Users can select various output file formats, such as shapefile (.shp), geodatabase (.gdb), or various CAD file formats.
The following is an example of extracting data within the Overview scale band:
Step 1: Select your scale band
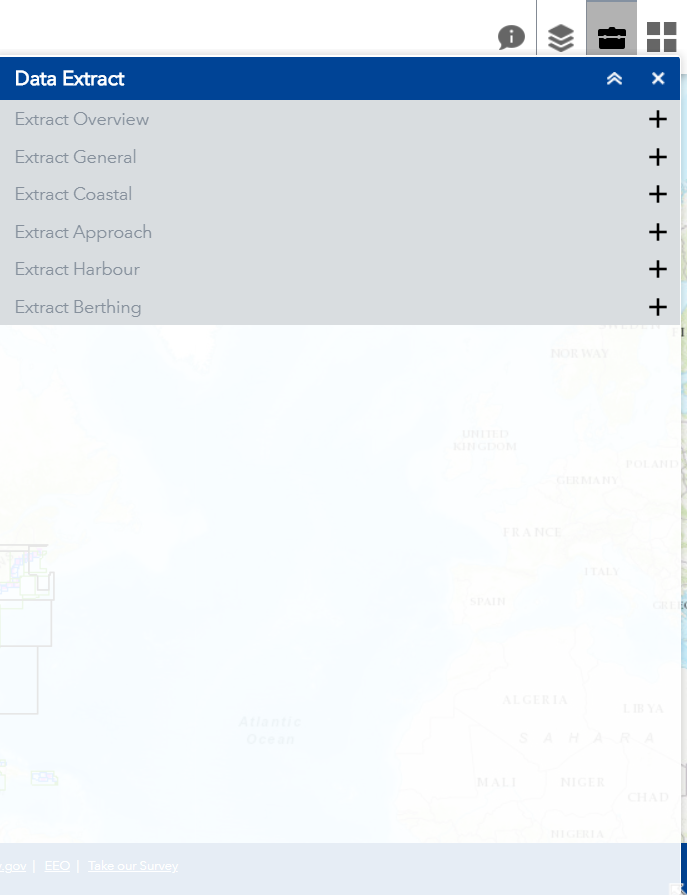 |
Click the Data Extract button to expand the six scale band choices: Overview, General, Coastal, Approach, Harbour, and Berthing Click Extract Overview. |
Step 2: Select your geographic limits and data layers
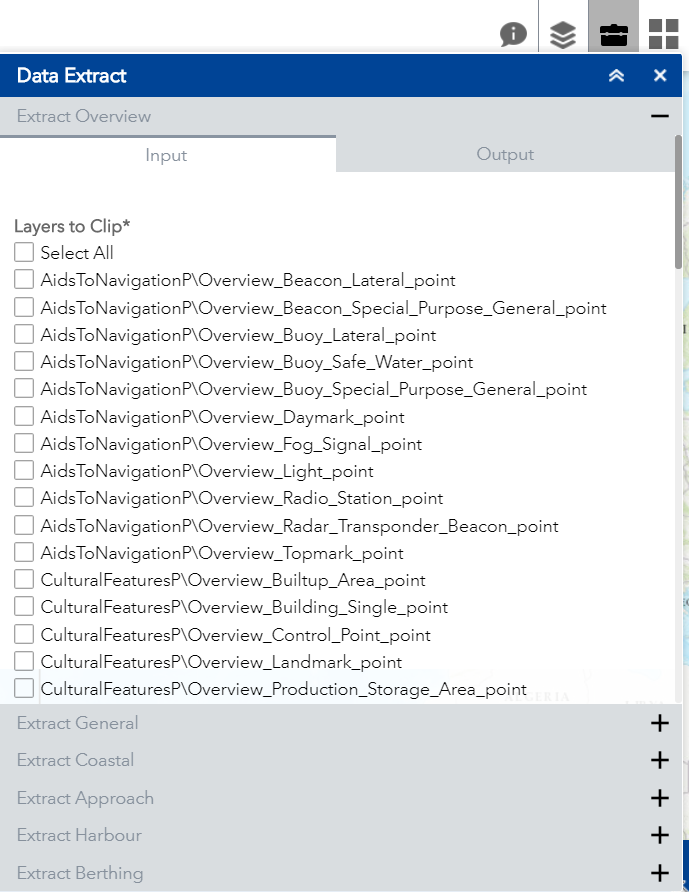 |
In the Extract Overview : |
Step 3: Save your data
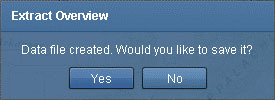 |
When the extraction is completed, the user will be prompted to save the output .zip file. The default output filename is 'extractedData.zip' - the user may rename it if desired. Please note that if the output .zip file is not renamed and another output .zip file is downloaded, the new output .zip file will override the previous output .zip file. |
 |
To view metadata for data layers: |
ENC Direct to GIS provides services for each scale band in a number of formats.
| Title | Esri Map Service | Esri Geoprocessing Service | Web Map Service | KML |
|---|---|---|---|---|
| ENC Overview | ||||
| ENC General | ||||
| ENC Coastal | ||||
| ENC Approach | ||||
| ENC Harbor | ||||
| ENC Berthing |
In addition, three specific theme layers can be viewed or obtained for the entire United States. These standardized data sets are based on several Federal Geographic Data Committee (FGDC) and Open Geospatial Consortium (OGC) standards.
| Title | ArcGIS Viewer | REST Service | Web Map Service | KML | Shapefile | Metadata |
|---|---|---|---|---|---|---|
| Coastal Maintained Channels | ||||||
| U.S. Maritime Limits & Boundaries | ||||||
| Shipping Lanes and Regulations |
ENC Direct to GIS data is in a format not certified for navigation. The data is derived from the official NOAA Electronic Nautical Charts (ENC) through GIS conversion software.
No, ENC Direct to GIS is not certified for navigation. You can download NOAA ENC®s for navigation.
The data layers have been created by merging S-57 object classes from all NOAA ENCs into seamless layers. For example, the coastline layer for the Harbour scale band is a composite of the S-57 object class COALNE from all current Harbour ENCs.
Use the free S-57 object catalog to look up layer and attribute definitions. (This service is for informational purposes only and does not constitute an endorsement by the U.S. Government.) In addition, you may click the 'Description' from the 'ENC Scale Band' drop down list for each scale band to get a list of available GIS layers.
The data layers are grouped in folders by thematic categories that describe the layers that they contain. ENC Direct to GIS contains more than 200 data layers, which are found by navigating through the appropriate folders/subfolders.
S-57 object classes contain multiple geometry types. For example, the WRECKS object class can contain point and polygon features. It is important to note that an S-57 object in ENC Direct to GIS can have point, line, and polygon parts.
Layers are configured with scale dependency. The data is displayed by scale band. As you zoom in at certain scale ratio, the application will display ENC data compiled for that scale band. For example, if you zoom in at scale 1:36,112, the application will display ENC data within the Approach and Harbour scale band. If you would like to find out which scale band you are viewing, simply click on the screen and a popup window will appear displaying the current ENC name.
In addition, to speed up the map service and reduce data clutter in the map frame, the point layers for the Overview scale band are displayed at a smaller scale within the Overview scale range. The scale range for the Overview scale band is ranged 1:1,500,001 or smaller. The line and area features are visible with a minimum scale ratio of 1:4,622,324. The point layers are visible with a minimum scale ratio of 1:2,311,162.
Data used is in GCS-WGS 1984 coordinate system.
The majority of NOAA charts use a Mercator projection, classified as a cylindrical projection upon a plane, the cylinder tangent along the equator. The Mercator is the most common projection used in maritime navigation, primarily because rhumb lines plot as straight lines.
All ArcGIS services and basemaps are stored with a continuous tiling system to support the seamless display of map data for large scale subareas. This requires a single map projection for the world. The spherical Mercator projection is used. This is often referred to as the WGS 1984 Web Mercator [Auxiliary Sphere] projection.
The time varies and depends on your Internet connection and the amount of data you wish to download. Downloading layers that have a smaller spatial extent is generally quicker than downloading layers for a large spatial extent.
We recommend selecting one scale band per extraction. If you select more than one scale band during the extraction process, you will obtain duplicate data at different resolutions. We recommend selecting the best scale band for the type of application for which you require the data.
The extraction tool gives you the ability to select more than one area. You will need to select the area polygon box again to draw more than one selected area. The extraction file will not separate the object classes by the different selected areas.
The NOAA ENC cells intended for navigation are updated for Notices to Mariners and other safety information. These updates are provided to navigational users of NOAA ENC cells as update patches. Periodically, NOAA ENC cells are released as complete new versions (called New Editions when referring to paper charts) that include all of the update patches.
ENC Direct to GIS data is updated every Saturday night. This includes all of the update patches or new editions available at that time.
Data contained in ENC Direct to GIS retains the accuracy of the original NOAA ENC data.