 An
official website of the United States government.
Here's how you know we're official.
An
official website of the United States government.
Here's how you know we're official.
An
official website of the United States government.
Here's how you know we're official.
An
official website of the United States government.
Here's how you know we're official.
Office of Coast Survey
National Oceanic and Atmospheric Administration
U.S. Department of Commerce
History of Hydrographic Surveying
In the years leading up to the Revolutionary War, and for half a century after that, ships sailing through this country's coastal waters had to rely on nautical charts with scant information or, too often, they had no charts at all. In the 1790s, Congress began authorizing specific and limited surveys of the coast. Congress and President Thomas Jefferson tried to rectify that on February 10, 1807, when legislation authorized a "survey to be taken of coasts of the United States." Because of a number of factors, the Coast Survey was not permanently organized until 1832. Finally, in 1834, the Survey took its first hydrographic soundings.
The first superintendent of the Coast Survey was Ferdinand Rudolph Hassler. He approached chart making methodically, stressing the importance of setting a permanent and true foundation for charts. Triangulate the coast. Make astronomical and magnetic observations, determine the latitude and the azimuth of certain lines. Look to the topography of the shoreline... then to the hydrography of the coastal waters. Hassler's plan was to begin at New York and work north and south, covering 11,000 square miles from Rhode Island to the Chesapeake Bay. Hassler died before he could complete his vision.
The second superintendent was Alexander Dallas Bache. He reorganized the Survey's work plans, dividing the coasts into segments, and setting priorities that would meet the growing nation's maritime and economic needs.
Coast Survey's first chart was presented as an "extract" chart of the "Harbour of Bridgeport, Conn.", transmitted to Congress in February 1836. Two additional extracts were printed, probably by private printers, before the Survey purchased a printing press in 1842. Hassler died the next year, and so did not see the first full chart printed by Coast Survey: the 1845 chart of New York-Bay and Harbor and the Environs.
Surveying methods have evolved as technologies have advanced:
Lead Line Survey
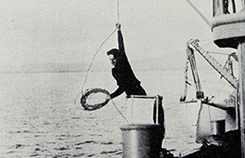
Early hydrographic surveys consisted of depths measured by sounding pole and hand lead line, with positions determined by three-point sextant fixes to mapped reference points. Lead lines were ropes, or lines, with depth markings and lead weights attached. The lines were lowered and read manually in a labor-intensive and time-consuming process. While the initial depth soundings may have been accurate, they were limited in number, and thus, coverage between single soundings was lacking.
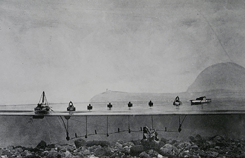
Wire Drag Survey
In 1904, weighted wire-drag surveys were introduced into hydrography, wherein a wire attached to two vessels was dragged between two points. If the wire (set at a certain depth by a system of weights and buoys) encountered an obstruction, it would become taut and form a "V," revealing the depth and position of submerged rocks and other obstructions.
Dorsey Fathometer
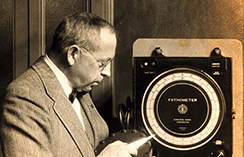
The 1930s saw the development and implementation of single-beam echo sounders that used sound to measure the distance of the sea floor directly below a vessel. By running a series of lines at a specified spacing, single beam echo sounders and fathometers greatly increased the speed of the survey process by allowing more data points to be collected. However, this method still left gaps in quantitative depth information between survey lines.
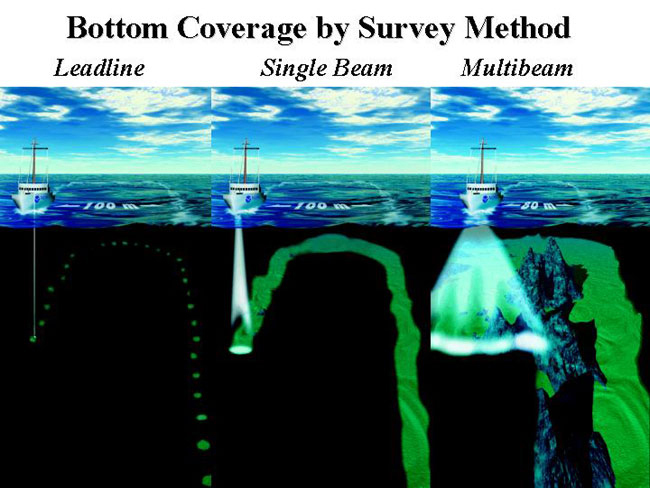
Sidescan and Multibeam Technologies
In the 1950s, 1960s, and 1970s, a number of evolutionary concepts were advanced that fundamentally changed how we look at and map the seafloor. Side scan sonar technology offered a qualitative means of obtaining the sonic equivalent of an aerial photograph and improved the ability to identify submerged wrecks and obstructions. Multibeam swath systems made it possible to obtain quantitative depth information for 100 percent of the bottom in a survey area.