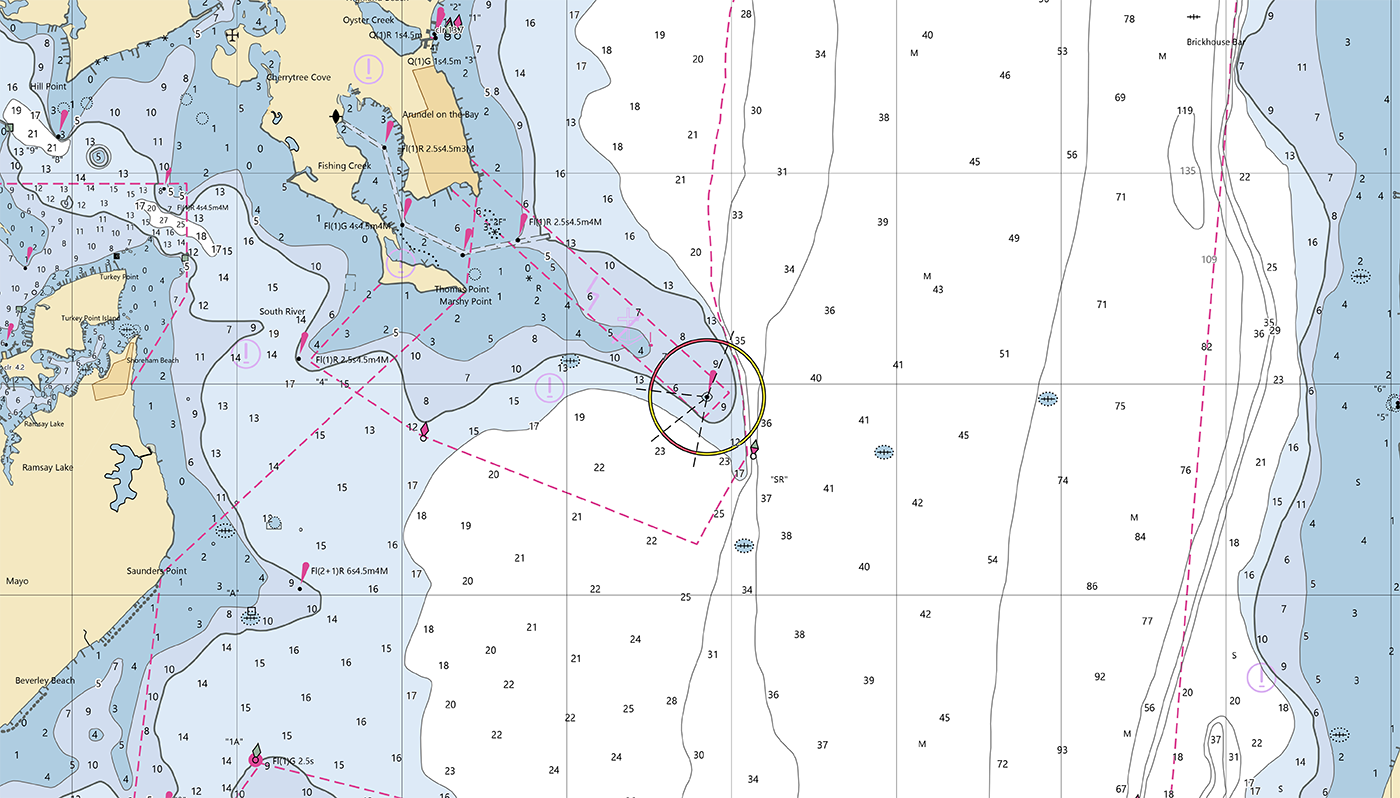
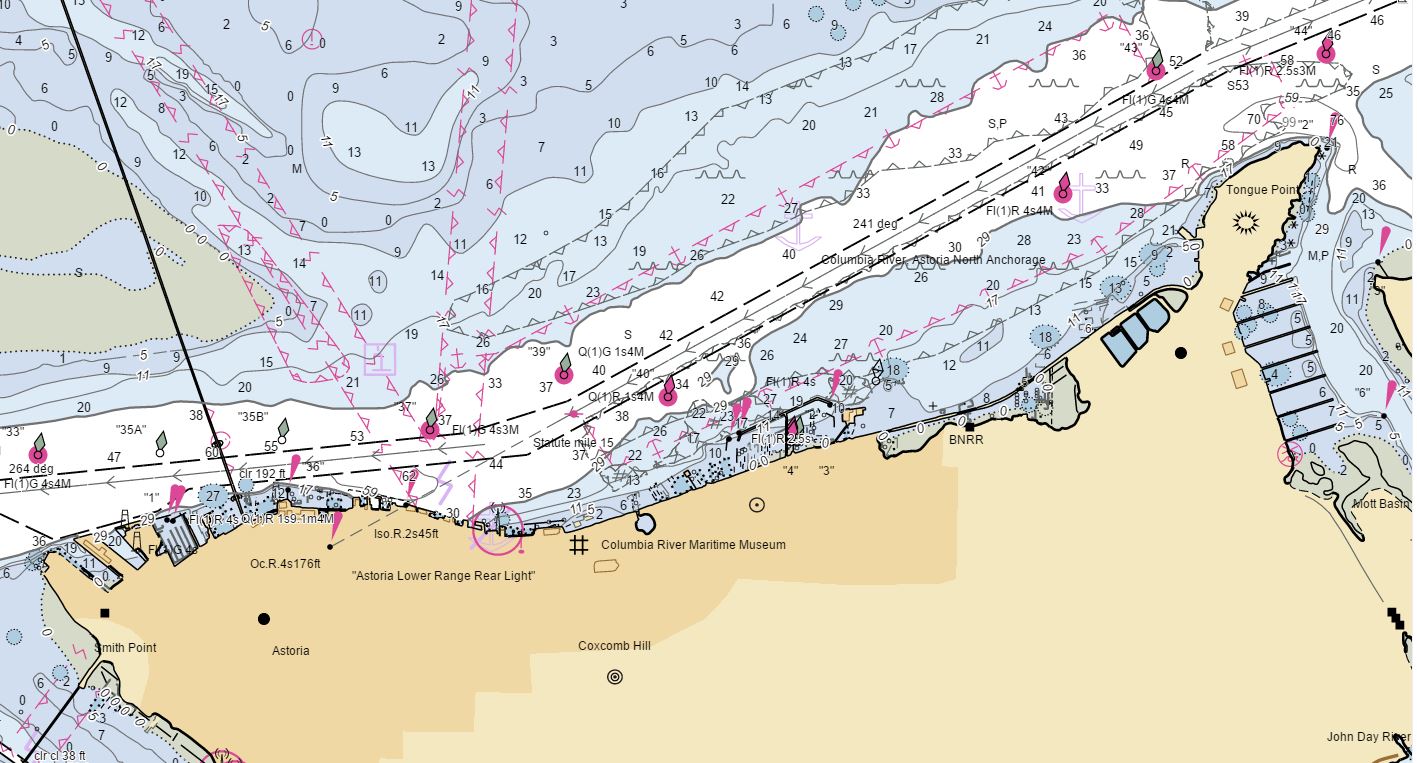
Have it your way – creating customized nautical charts using the latest data

An image showing the output of the NOAA Custom Chart application with a chart covering the western side of the Chesapeake Bay.

Nautical charts have always contained a great amount of information – even more so with electronic navigational charts. This information is constantly being updated, necessitating the need to keep your nautical chart suite as current as possible. The Office of Coast Survey’s online NOAA Custom Chart application enables users to create nautical charts directly from the latest official NOAA electronic navigational chart (NOAA ENC®) data. Users now have the ability to create their own nautical charts using individually set parameters, and then save this custom nautical chart as a file that can be viewed or printed.

Continue reading “Have it your way – creating customized nautical charts using the latest data”

Coast Survey launches NOAA Chart Display Service

This is a graphic showing an electronic navigational chart depicting the entrance to the Columbia River and Astoria, Oregon. Graphical information on the chart is rendered by the new NOAA Chart Display Service and shows traditional paper chart symbols.

The new NOAA Chart Display Service (NCDS) renders NOAA electronic navigational chart (NOAA ENC®) data with “traditional paper chart” symbology in online and offline applications for which a basemap of nautical chart data is desired, including GIS, web-based, and mobile mapping applications. The new service uses symbols, labels, and color schemes familiar to those who have used NOAA paper nautical charts or the NOAA Custom Chart application. NCDS is available as Esri REST Map Service, OGC Web Map Service (WMS), and MBTiles formats.

Continue reading “Coast Survey launches NOAA Chart Display Service”