Since 1807, Coast Survey has endured to keep mariners safe and maritime commerce flowing, under the leadership of now 32 superintendents and directors. 2025 was Coast Survey’s last under Rear Admiral (lower half) Benjamin K. Evans, who was relieved as Director in early 2026 by Rear Admiral (lower half) Christiaan van Westendorp.
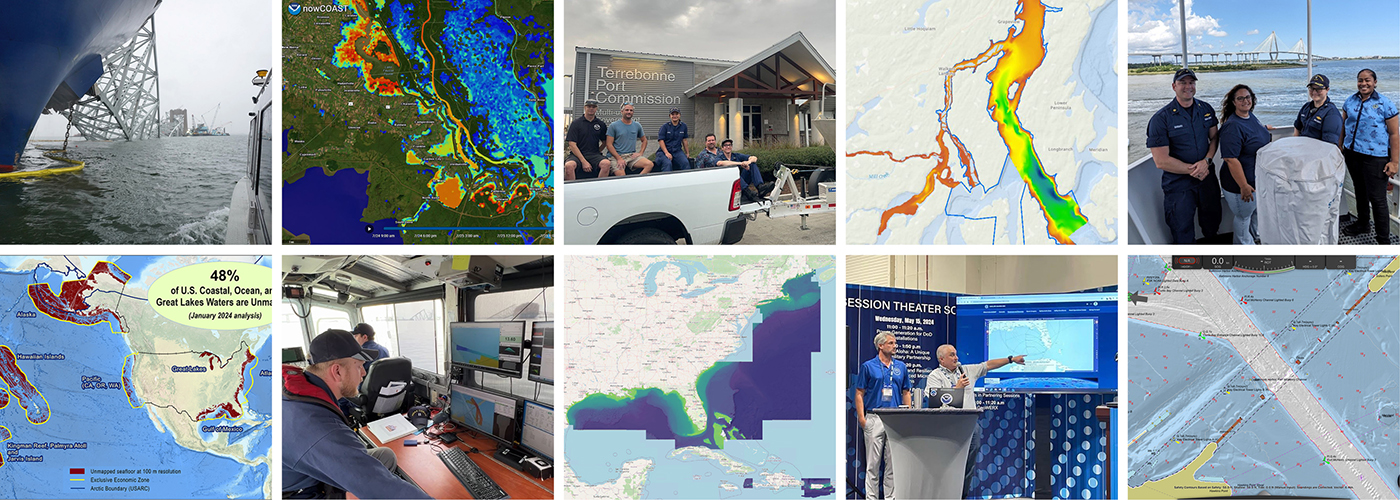
Coast Survey is excited for what’s to come under RDML van Westendorp’s leadership–the continued evolution of the National Bathymetric Source program, two new hydrographic ships built from the keel-up to incorporate uncrewed systems, more S-100 rollouts, and more–but wanted to first look back on everything the office accomplished in 2025 to build a strong foundation for a safer, more efficient marine economy.
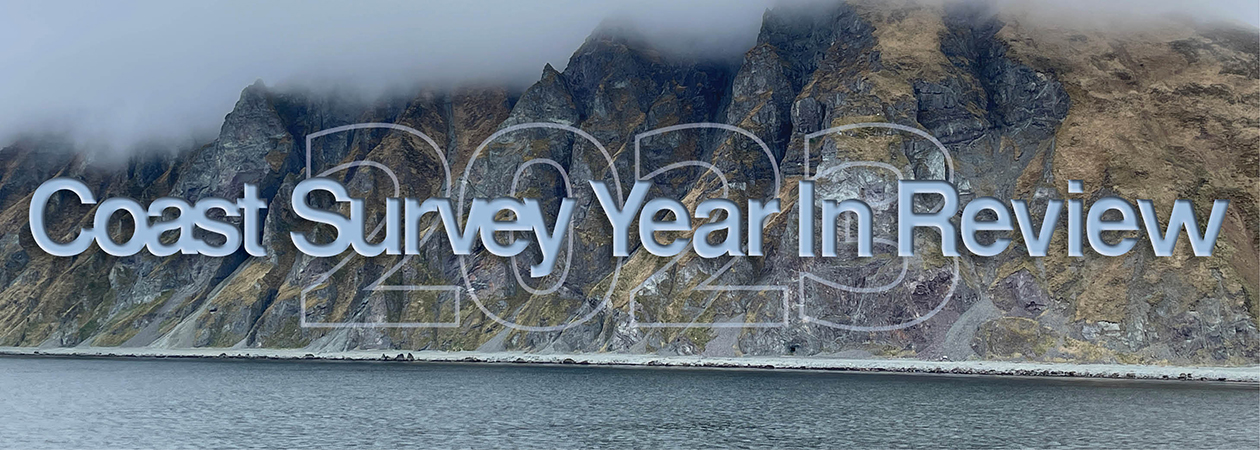
Continue reading “Office of Coast Survey: 2025 Year in Review”