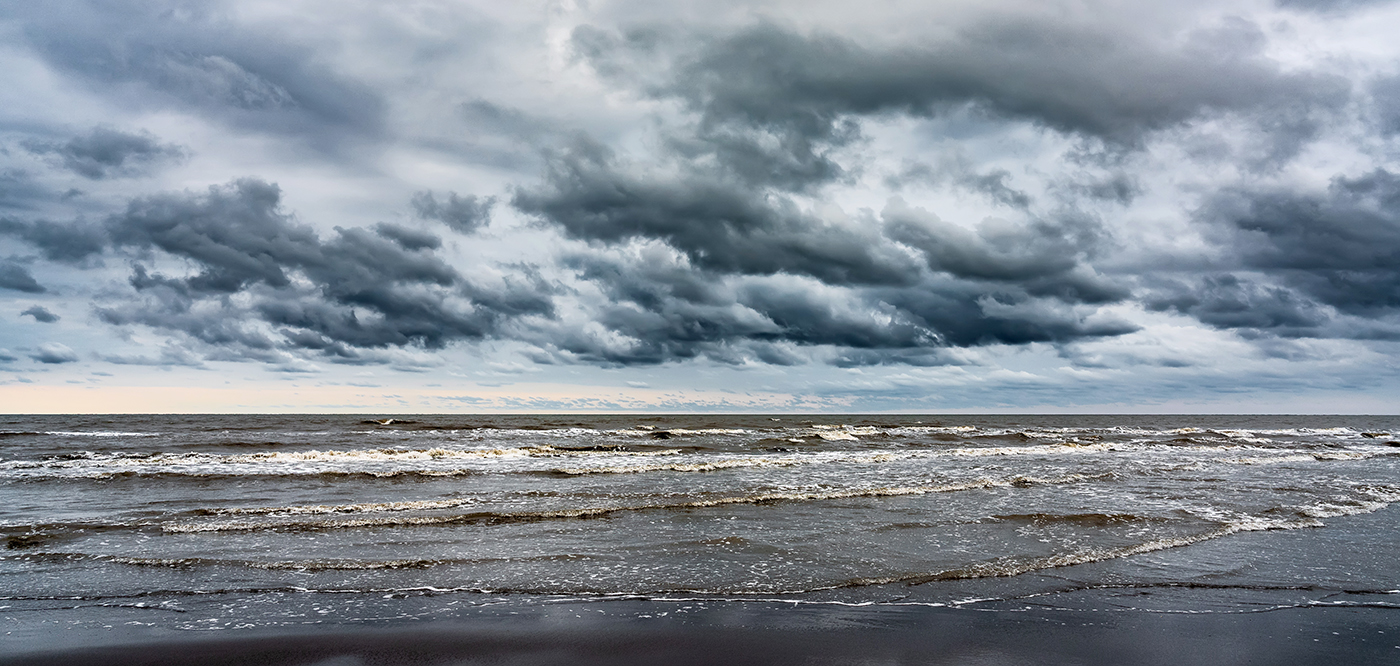
Imagine navigating a vessel along the coast and planning the approach to your destination, whether that be a local marina or large vessel berth in a harbor. What factors affecting the movement of the vessel should you be aware of once underway and in transit through the entrance and into the port? These may include observations on the present and forecasted weather, water current speed and direction, water depths and tidal direction, and any anomalies or warnings that may exist. Knowing what these factors are will assist you in preparing your vessel for safe passage to the destination.
Marine navigators have a need to access several types of data in order to make informed decisions prior to leaving or returning to port, and while underway. NOAA’s nowCOAST provides a graphical map viewer where anyone can visit and view data pulled from various sources.
NOAA’s nowCOAST is a cloud-based web mapping GIS portal to real-time coastal observations, forecasts, and warnings of interest to the maritime and coastal communities. Covering all coastal waters of the United States including the Great Lakes, the portal serves as a “one-stop” website to real-time coastal meteorological, oceanographic, and hydrologic observations, analyses, imagery, forecasts and alerts from across NOAA and other federal agencies such as the National Aeronautics and Space Administration (NASA). NowCOAST is designed as a planning aid for recreational and commercial mariners, coastal managers, HAZMAT responders, search and rescue operations, educators, and researchers, who can discover and display real-time information for their particular needs and geographic area of interest. In addition to the interactive map viewer, nowCOAST provides publicly available web mapping services which allows users to consume maps directly from nowCOAST into their application.
Accessing the data
The different types of data and information on nowCOAST can be accessed and visualized via the nowCOAST map viewer which focuses on a map of the United States on the initial visit. On the right side of your screen, there is a menu interface where various data layers can be toggled on or off. A few of the layers are active by default but these may be switched off if desired. At the top of this menu, users can change the basemap or background and view a map legend. The nowCOAST viewer is mobile friendly, so it can be used on a personal computer, tablet, or mobile phone.
Types of data available
Following is breakdown of specific layers that are currently available, accompanied with a short description and data source.
Active Alerts
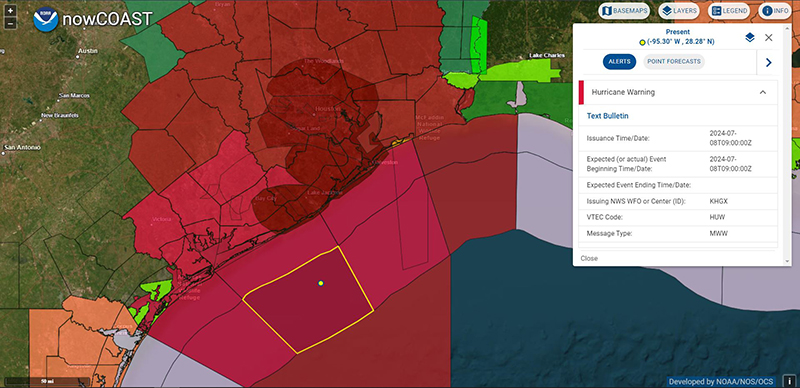
The latest National Weather Service (NWS) watches, warnings, advisories, and statements for hazardous weather, marine weather, hydrologic, oceanographic, wildfire, air quality, and ecological conditions which may affect or are presently affecting inland, lake, coastal, and offshore areas. Source: National Weather Service.
BlueTopo
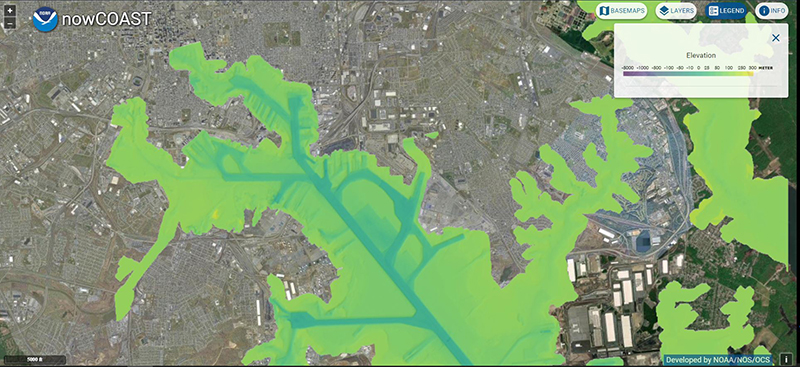
The National Ocean Service’s (NOS) curated bathymetric source data providing a definitive nationwide model of the seafloor and the Great Lakes called BlueTopo. Products generated with these data should not to be used for measurements or marine navigation. Additional data are incorporated as more gridded bathymetry becomes available from the National Bathymetric Source program. Source: NOS/Office of Coast Survey.
Convective Outlooks
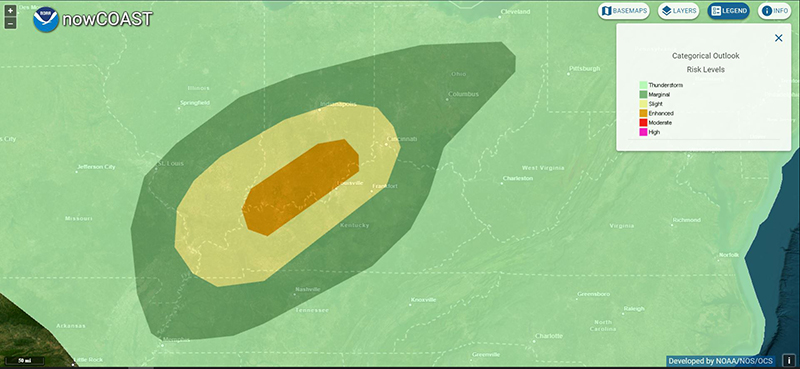
The latest National Weather Service Storm Prediction Center’s convective categorical and probabilistic outlooks for days 1, 2, and 3, and severe weather outlook for days 4 through 8. Source: NWS/National Centers for Environmental Prediction Storm Prediction Center.
Federal Boundaries
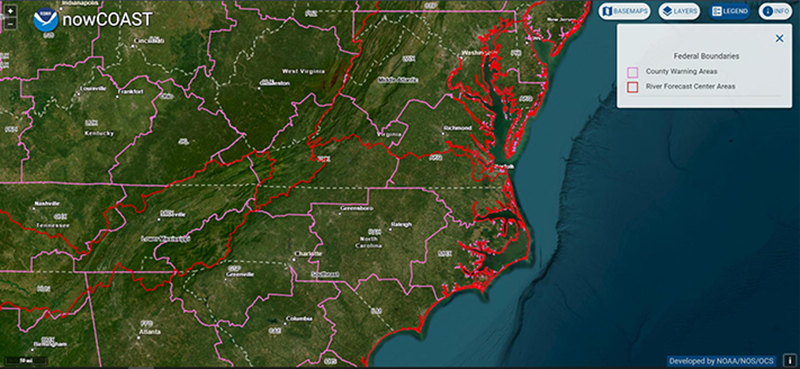
The County Warning Area boundaries depict the geographic areas of responsibility of NWS Weather Forecast Offices. The office’s are responsible for issuing public, marine, fire, and aviation weather forecasts and advisories, watches, and warnings. In addition, NWS River Forecast Centers’ boundaries depict the geographic areas of responsibility of the 13 NWS River Forecast Centers. Source: National Weather Service.
Gridded Forecasts
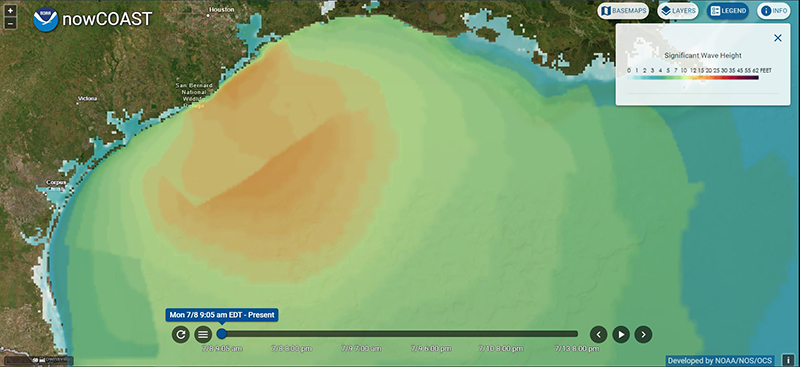
Forecasts of sensible weather variables such as cloud cover, wind speed, and significant wave height, generated by the weather forecasters at regional NWS Weather Forecast Offices and the National Centers for Environmental Prediction. Source: NWS’s National Digital Forecast Database.
Inland-Coastal Flooding
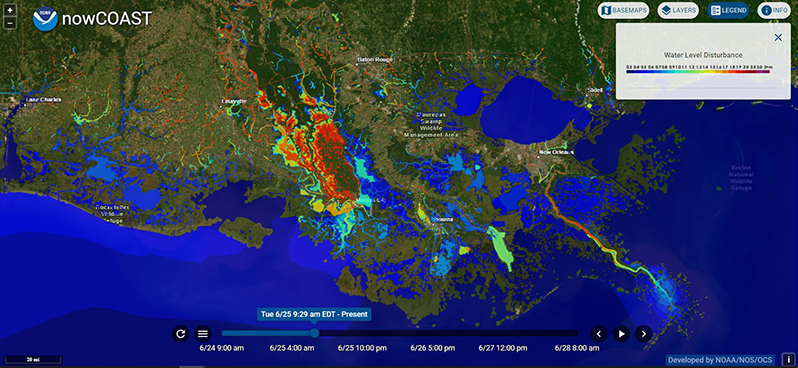
The latest forecast guidance from the NOS Surge and Tide Operational Forecast System 3D, which produces water level predictions of compound flooding due to tides, storm surge, and riverine flooding out to 48 hours for the Western Atlantic Ocean including the Gulf of Mexico. Source: NOS/Office of Coast Survey.
Lightning Detection
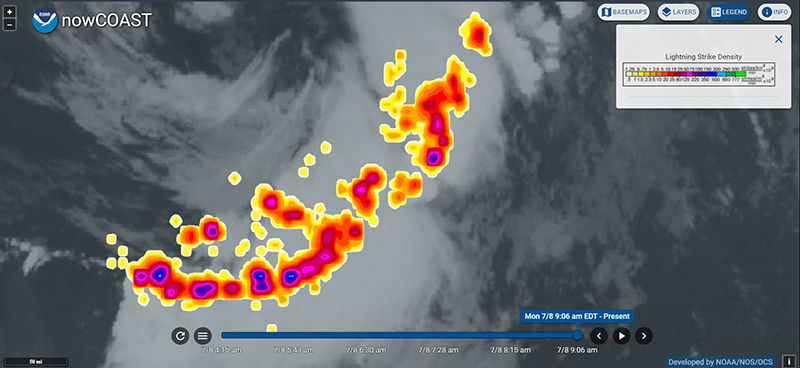
The lightning strike density data include both cloud-to-ground strikes, cloud-to-ground flash information and survey level cloud lightning information from the U.S. National Lightning Detection Network and the Global Lightning Detection Network. The purpose of this product is to enhanced awareness of developing and transitory thunderstorm activity, especially beyond weather radar coverage over water. Source: NWS/National Centers for Environmental Prediction Ocean Prediction Center.
Marine Pathogens

Latest model forecast guidance of probability of occurrence of the Vibrio vulnificus (Vv), a marine pathogen which can cause illness, in the Chesapeake Bay. The Vv forecast guidance is issued once per day for Chesapeake Bay based on predictions from the NOS Chesapeake Bay Operational Forecast System. The guidance includes predictions for the present day (Day 1) and the next day (Day 2). Source: NOS/Center for Operational Oceanographic Products and Services and the National Centers for Coastal Ocean Science.
Nautical Charts
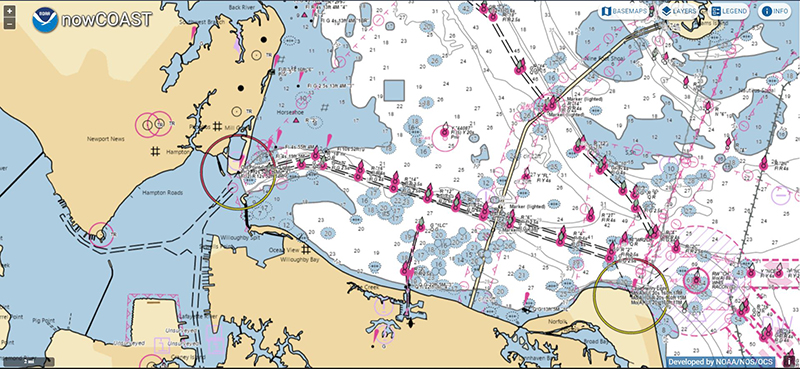
The external NOAA Chart Display Service renders NOAA electronic navigational chart data with traditional paper chart symbols, labels, and color schemes familiar to those who have used NOAA paper nautical charts or the NOAA Custom Chart application. Source: NOS/Office of Coast Survey.
Precipitation Amounts
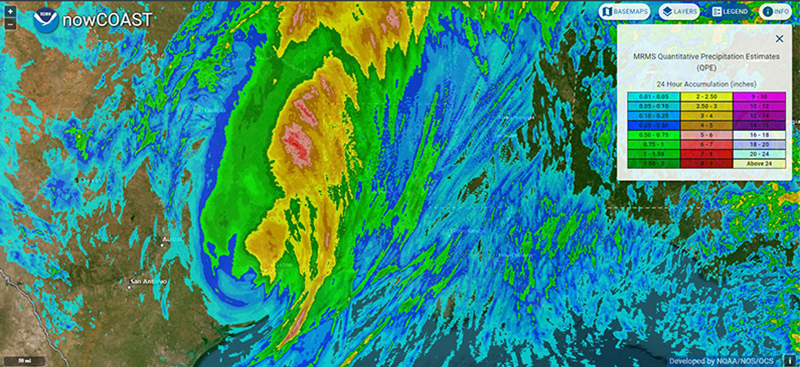
Latest NWS multi-radar multi-sensor quantitative precipitation estimate mosaics for 1-, 3-, 6-, 12-, 24-, 48-, and 72-hour durations at 1 kilometer (0.6 miles) horizontal resolution for the continental United States, southern part of Canada, Alaska, Hawaii, and Puerto Rico. The estimates are based only on weather radar data and are updated every hour for the period ending at the top of the hour. Source: NWS and Office of Atmospheric Research/National Severe Storms Laboratory.
S-100 Product Coverage
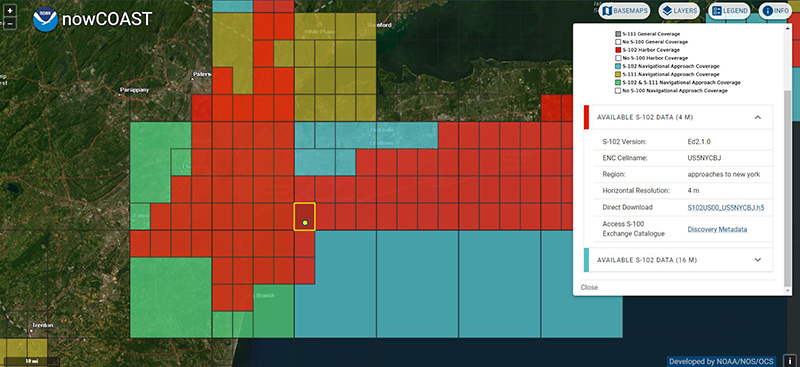
S-100 is an international hydrographic geospatial data standard that can support a wide variety of hydrographic-related digital data sources. The S-100 product coverage service provides maps of the present geographic coverage for NOAA’s S-111 Surface Currents and S-102 Bathymetric Surface information. NOAA’s S-100 products are arranged in a tiling and naming scheme corresponding to NOAA’s electronic navigational charts. Users can select the maps to obtain basic metadata for the S-111 and/or S-102 data for the geographic area of interest and download datasets for the selected area. The coverage maps will be updated as more NOAA S-100 products become available. Source: NOS/Office of Coast Survey.
Sea Surface Temperature
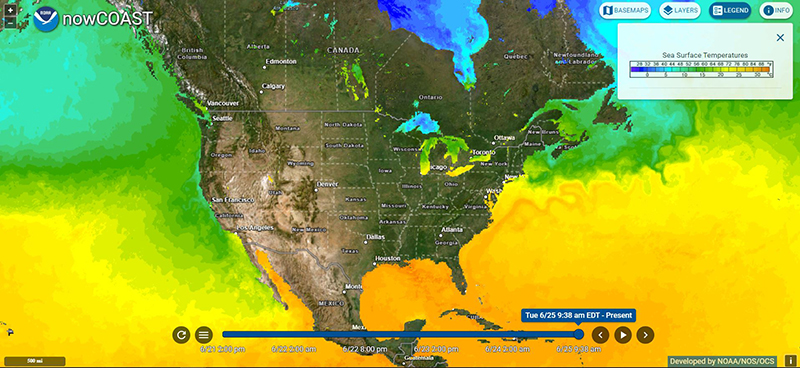
Surface water temperatures estimates for large portions of the North Atlantic and North Pacific Ocean, the Great Lakes, and many large inland lakes, like Lake Champlain. The analysis is a composite of data and analyses from NASA, NOAA’s National Environmental Satellite, Data, and Information Service, and the United Kingdom Meteorological Office. In addition, the latest global surface water temperature global analysis is generated by the Global Data Assimilation System and the Global Forecast System. The analysis provides estimates of surface water temperatures for the world’s oceans, seas, and the Great Lakes. Source: NASA and NWS.
Surface Observations
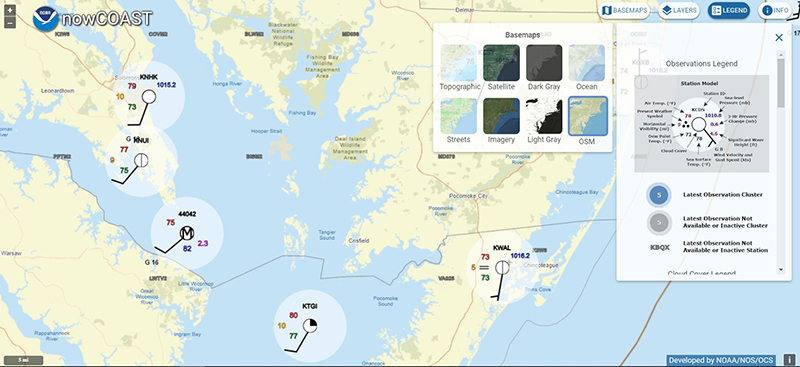
The latest in-situ surface weather and marine weather observations at observing sites using the World Meteorological Organization’s international station model. The station model depicts present weather conditions, cloud cover, wind direction, wind speed, wind gust, visibility, air temperature, dew point temperature, air pressure adjusted to mean sea level, and the change in air pressure over the last three hours. In addition, for observations from marine sites such as coastal stations, buoys, and ships, the station model also includes sea surface water temperature and significant wave height. Source: National Weather Service.
Surface Water Currents
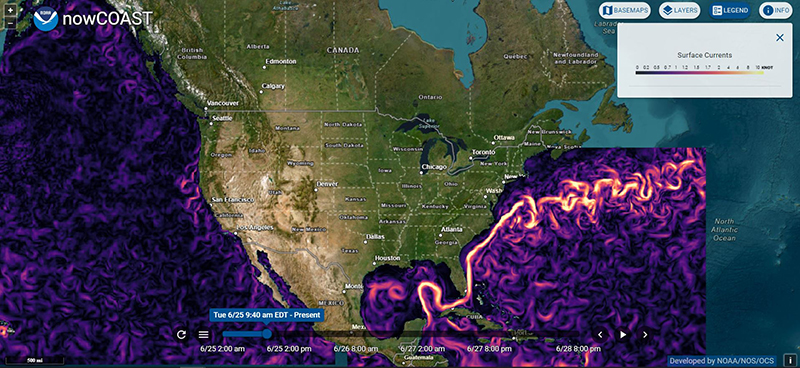
Latest model forecast guidance of water currents from NOS Operational Oceanographic Forecast Modeling Systems for oceans, coastal ocean and Great Lakes and for the Western Atlantic Ocean and Eastern Pacific Ocean from the NWS Global Real-Time Ocean Forecast System for the next few days. Source: NOS and NWS/National Centers for Environmental Protection.
Tropical Cyclones
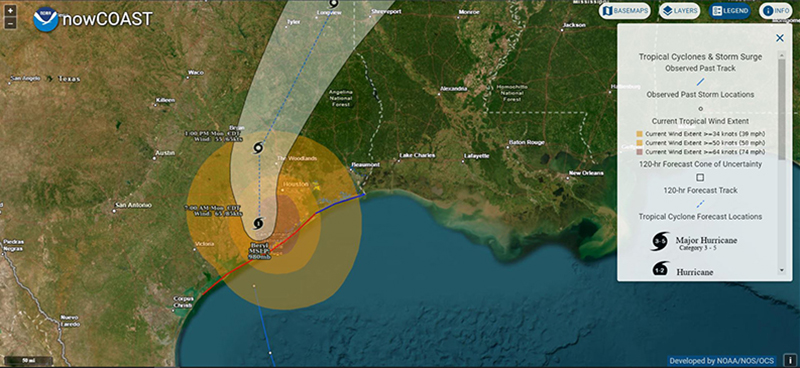
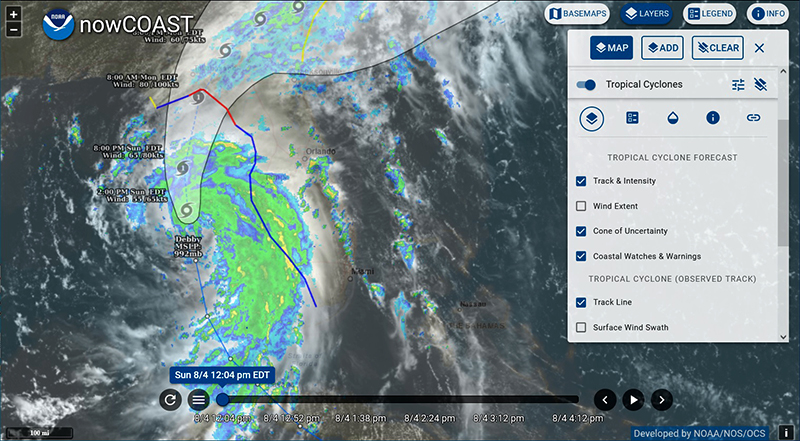
Latest forecast information for tropical cyclones in the Atlantic, Gulf of Mexico, Eastern and Central Pacific from the NWS hurricane centers including forecast intensity, track, cone of uncertainty, wind radii, and coastal tropical cyclone watches and warnings as well present and past locations. Source: NWS/National Hurricane Center and Central Pacific Hurricane Center.
Tropical Storm Surge
Latest potential storm surge flooding map for any significant landfalling tropical cyclone expected to impact the Atlantic or Gulf of Mexico coasts of the contiguous United States. The map depicts the geographical area where there is a risk of inundation from storm surge along with the potential heights, above ground, that water could reach in those areas. Once issued, the map is updated every six hours alongside each new forecast advisory for the associated tropical cyclone. Source: NWS/National Hurricane Center.
Weather Radar
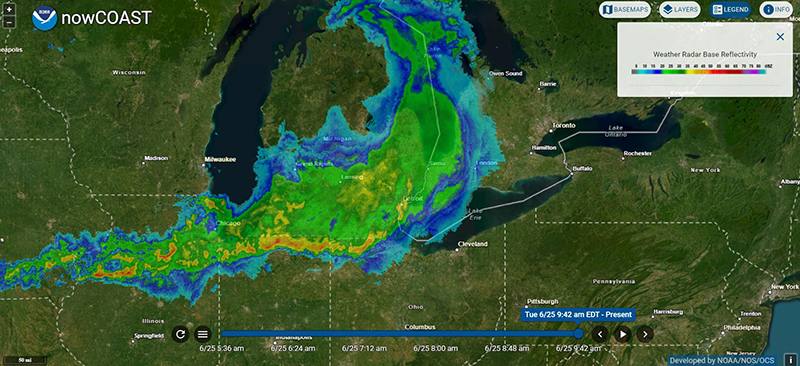
The latest weather radar base reflectivity mosaics are created using data from the U.S. Weather Surveillance Radar 1988 Doppler sites and from the Canadian Environment and Climate Change radar network. The horizontal resolution is one kilometer (0.62 miles). The mosaics are updated approximately every two minutes. Source: NWS and Office of Atmospheric Research.
Weather Satellite
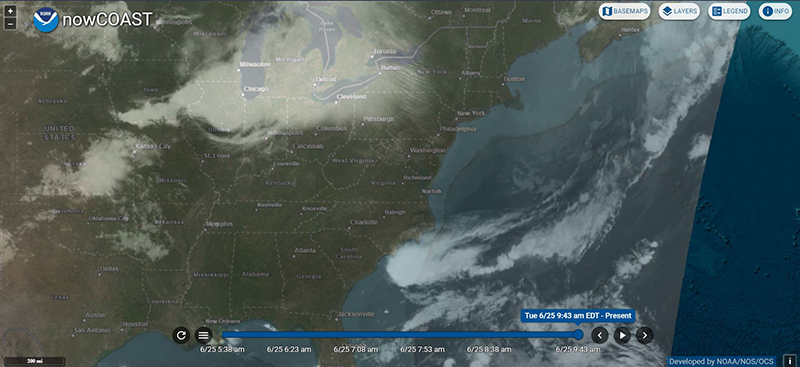
The latest weather satellite imagery including visible, water vapor, shortwave, longwave, and snow/ice composited from various geostationary satellites orbiting the globe. The service is updated with NOAA/NASA Geostationary Operational Environmental Satellites East/West composite images every five minutes and NOAA/NESDIS Global Mosaic of Geostationary Satellite Imagery global composite images every hour. Source: National Environmental Satellite, Data, and Information Service.
Zone Forecasts
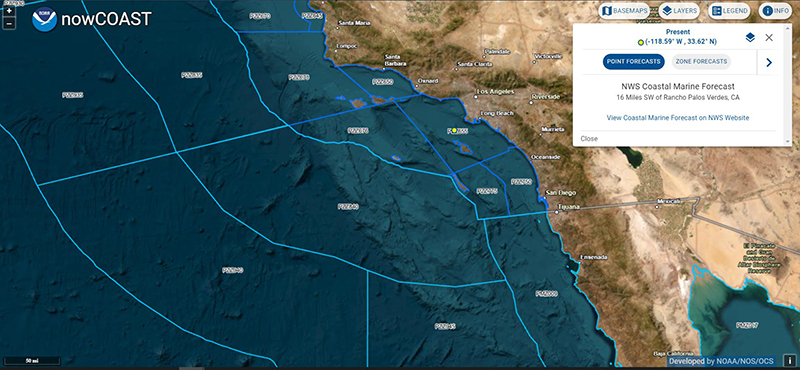
The Beach and Surf Zone Forecasts provide geo-referenced links to NWS forecasts for specific beach areas for the next two days. The text forecasts are usually issued at least once per day on a seasonal basis, but can be issued year-round. The Coastal Waters and Great Lakes Forecasts provide geo-referenced links to NWS marine weather forecasts for five days for coastal waters and also the nearshore and open lake areas of the Great Lakes. The Offshore Waters Forecasts provide geo-referenced links to NWS offshore marine weather forecasts for five days. The High Seas Forecasts provide geo-referenced links to NWS high seas marine weather forecasts for 48 hours for the high seas. The Public Weather Zone Forecasts include links to the latest NWS surface weather forecasts for the next seven days usually at the county-scale or sub-county scale. The Fire Weather Zone Forecasts include links to NWS web pages posting the latest zone-type forecast providing the average fire weather conditions across the zone for the next few days. Source: National Weather Service.
Future Improvements
The Office of Coast Survey is consistently improving NOAA’s nowCOAST, making it as useful as possible to the marine and coastal community. Planned upgrades include improved testing, monitoring, providing additional forecast guidance from the NOS Surge and Tide Operational Forecast System, and NWS P-Surge Modeling System. In addition, work will begin to generate S-104 files containing water level forecast guidance from the Surge and Tide Operational Forecast System 2D for selected geographic areas.

