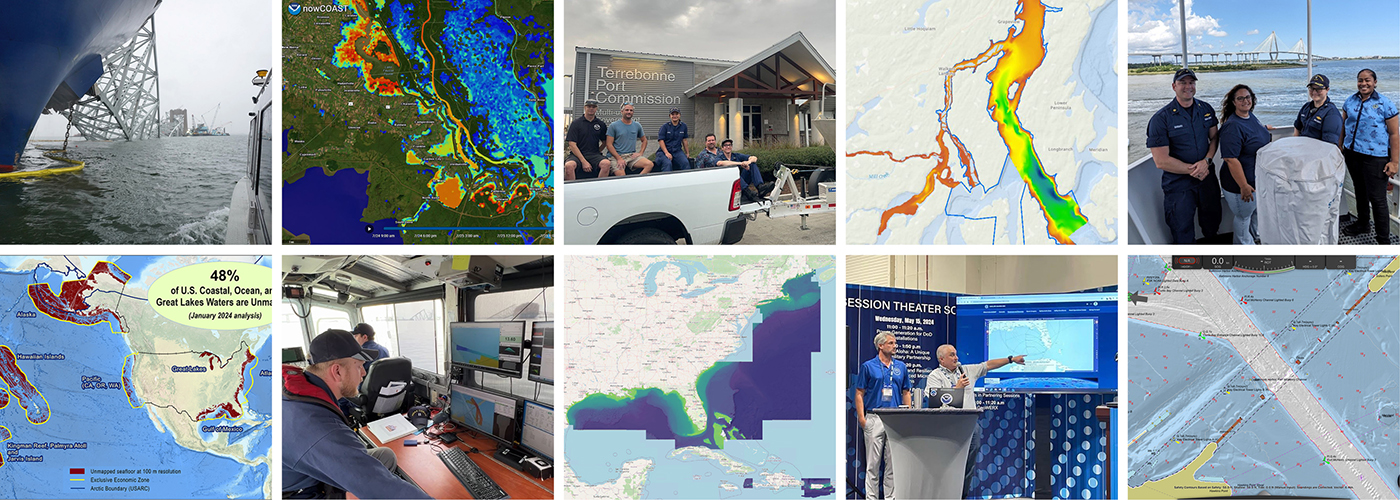
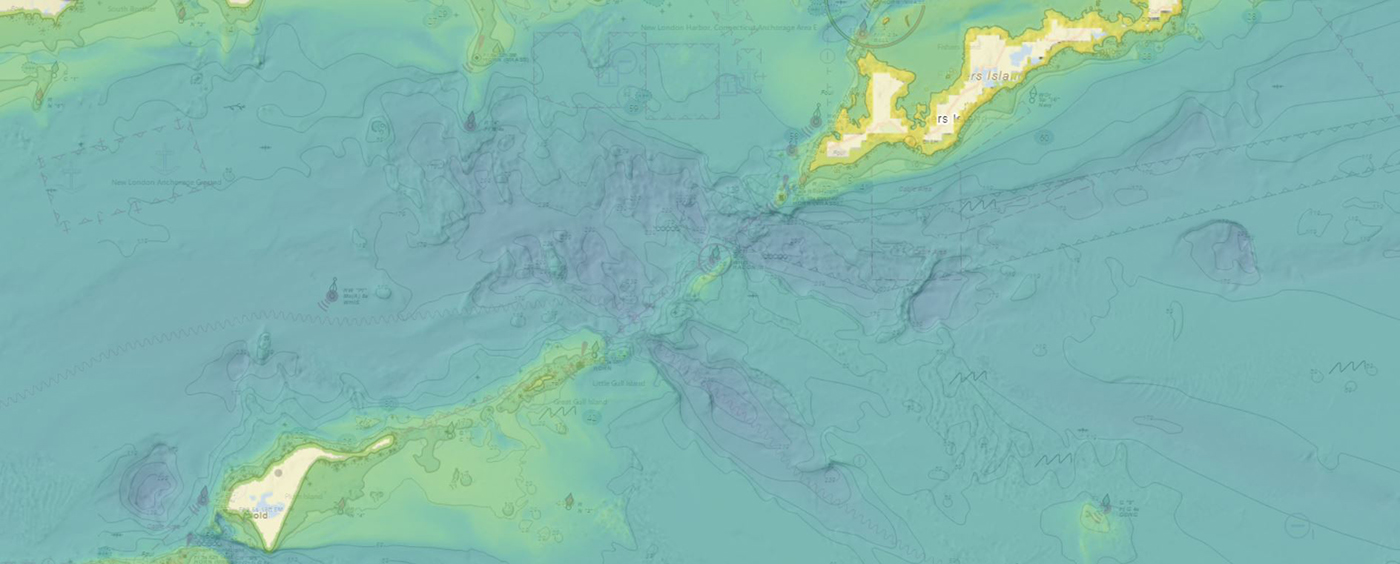
A look back at 2023 and the Office of Coast Survey’s significant activities throughout the year

An image of a rocky coastline and low clouds with the title Coast Survey Year in Review, superimposed over it.

NOAA’s Office of Coast Survey is reflecting on a successful and remarkable 2023! We completed many significant activities with meaningful impacts. As we look ahead to more progress in 2024, we are proud to share some highlights of the past year in our Coast Survey Year in Review ArcGIS StoryMap.

Continue reading “A look back at 2023 and the Office of Coast Survey’s significant activities throughout the year”

Historical Hydrography on the St. Mary’s River

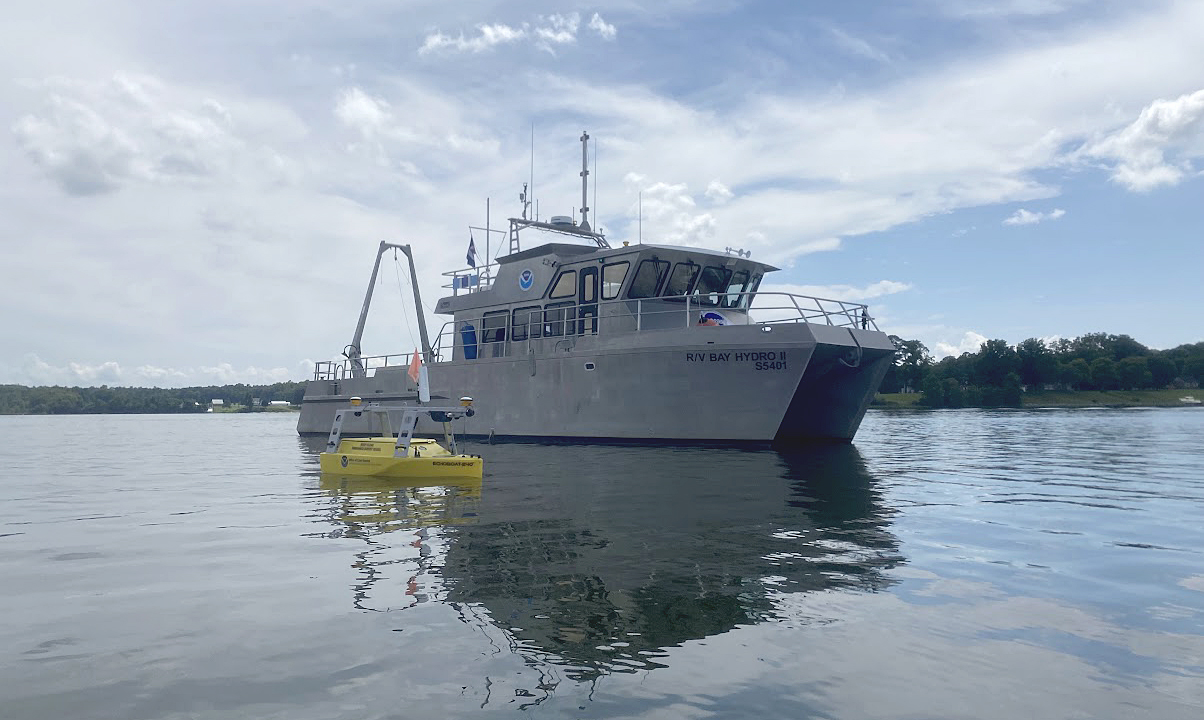
An image of NOAA's Bay Hydro II on the water with the Echoboat 240, uncrewed system in the foreground.

By Riley O’Connor

In November 1633, the Ark and the Dove set sail from the Isle of Wight—an island off the south coast of England—carrying English and Irish settlers bound for the new colony of Maryland. By January 1634, both vessels arrived at the Island of Barbados and began heading for the colony of Maryland. These settlers sailed into the Chesapeake Bay, the Potomac River, and eventually, the St. Mary’s River.  They stopped roughly 12 miles (19 km) northwest from Point Lookout, where the Potomac River enters the Chesapeake Bay. This group of settlers would go on to found Maryland’s first European settlement and future provincial capital, St. Mary’s City.

Continue reading “Historical Hydrography on the St. Mary’s River”

Geospatial information in the Southwestern Pacific

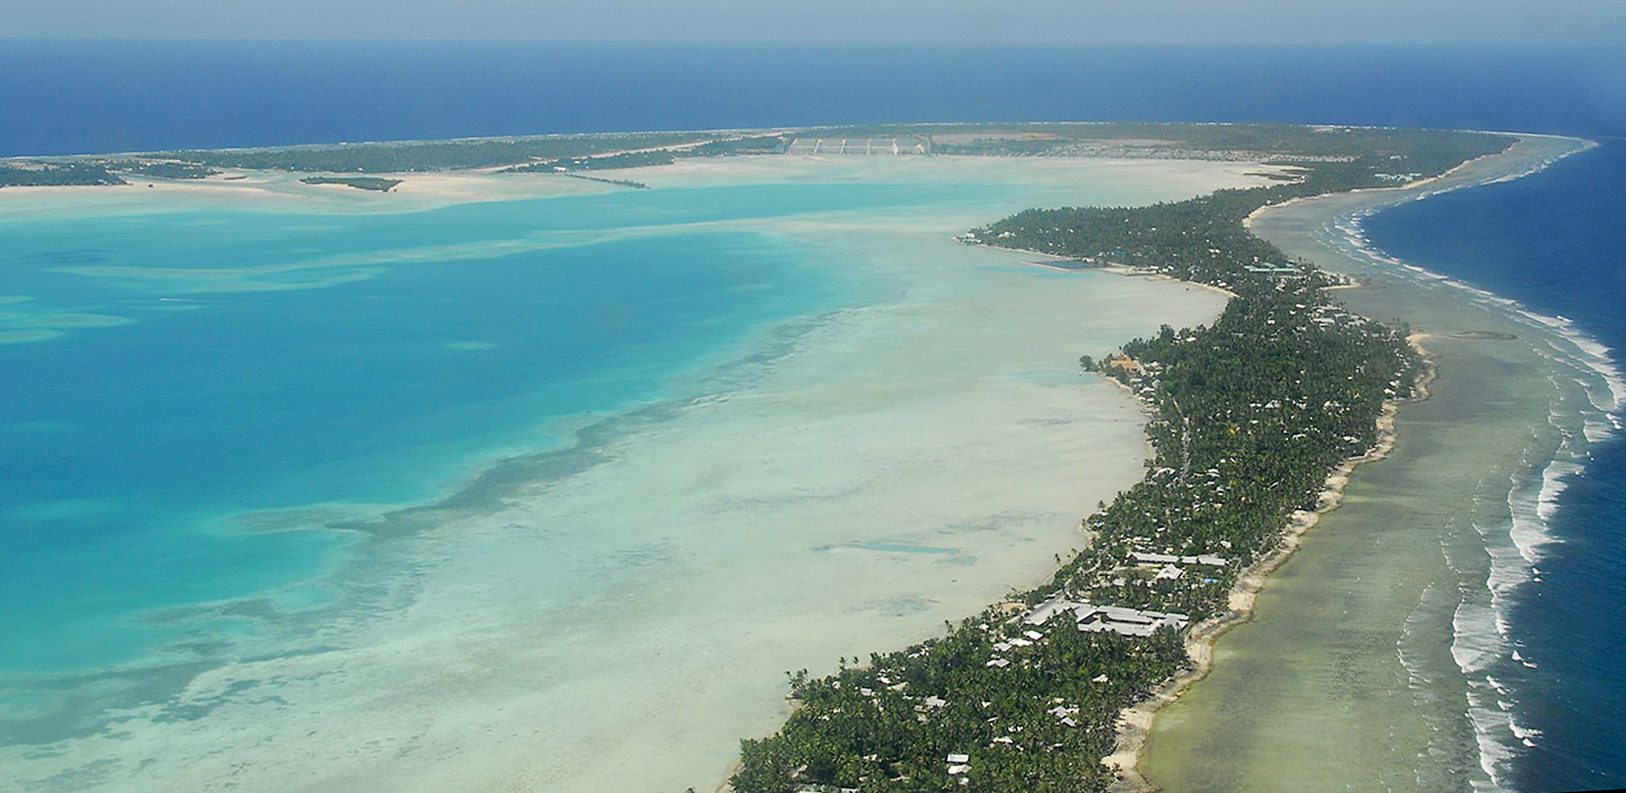
An image of the Island of Tarawa, part of the Republic of Kiribati in the Central Pacific.

By Dr. John Nyberg

An image of Dr. John Nyberg
Dr. John Nyberg

NOAA’s Office of Coast Survey Deputy Hydrographer Dr. John Nyberg participated in a State Department Science Fellowship through the U.S. Embassy in Suva, Fiji this past summer. The fellowship’s main goal for the region is to assist in accelerating the use of coastal and marine spatial planning for marine conservation and to deliver a curriculum to support it. Dr. Nyberg was asked to pay particular attention to engaging Kiribati (pronounced Kiribas), home to the Phoenix Islands Protected Area, one of the world’s largest and most important protected areas. The government of Kiribati is in the process of re-evaluating their approach toward managing the area, and one of the primary goals is to encourage the use of marine spatial planning in that process.

Continue reading “Geospatial information in the Southwestern Pacific”

NOAA-NSF collaboration – evaluating coastal models utilizing Texas Advanced Computing Center services

The Unified Forecast System (UFS) is a proposed community-based earth modeling system that is designed to incorporate oceanographic forecast model core(s) into a simplified NOAA modeling suite. This simplification is intended to reduce the footprint of the number of NOAA models and thus reduce development, operations, and maintenance.

Continue reading “NOAA-NSF collaboration – evaluating coastal models utilizing Texas Advanced Computing Center services”

NOAA ocean mapping and reef surveys in the Mariana Islands

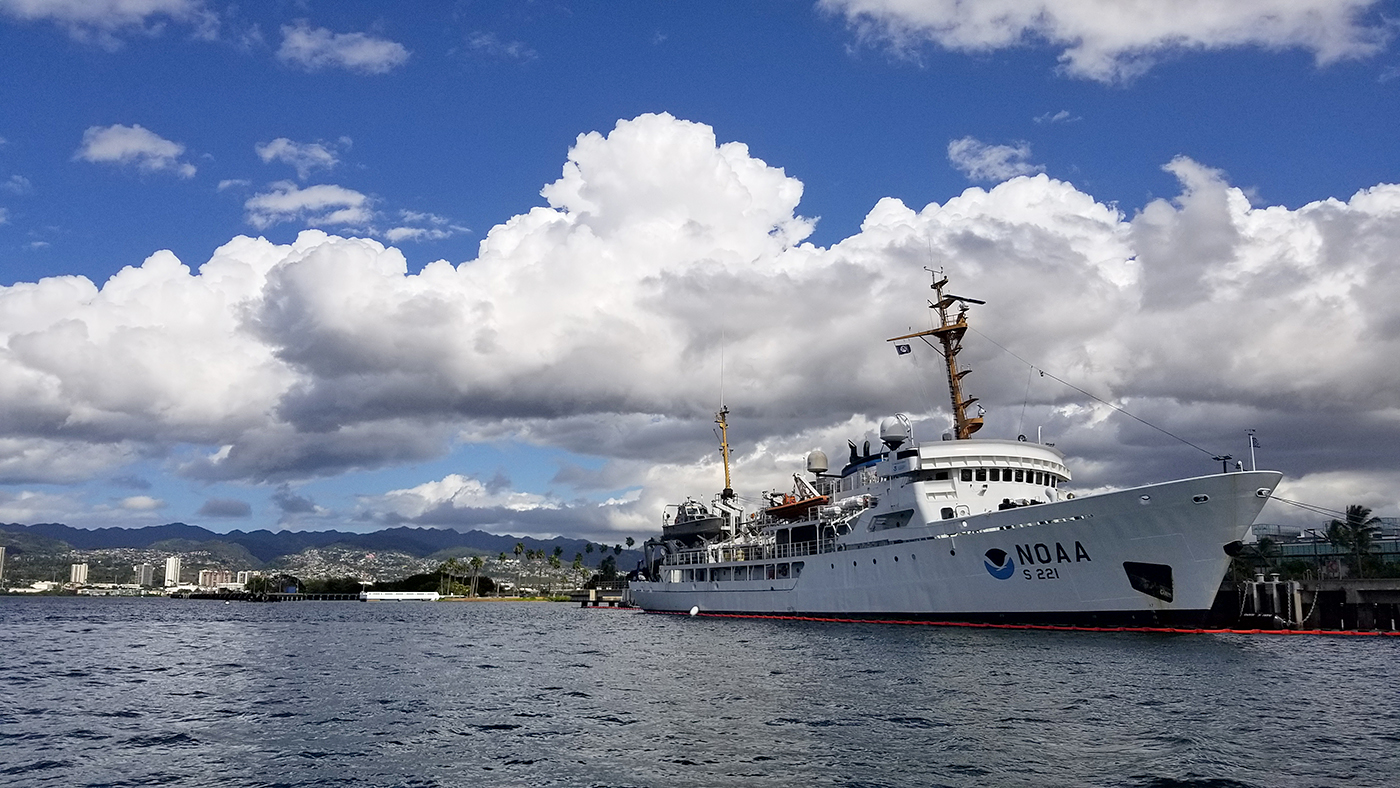
NOAA Ship Rainier alongside Ford Island in Pearl Harbor, Hawaii. on a sunny day with white clouds in the sky.

On March 26, NOAA Ship Rainier  set sail from Honolulu, Hawaii on a 3,307-nautical mile expedition to the Western Pacific. Originally planned for 2020, this will be the ship’s first multidisciplinary expedition to Guam and the Commonwealth of the Northern Mariana Islands. This collaborative mission between NOAA’s National Ocean Service and National Marine Fisheries Service will deliver high‐quality data, data products, and tools to the region including a seamless map linking hilltops to underwater depths and integrated data on the surrounding coral reef ecosystems. These data can provide information for countless users to make critical management decisions within disciplines such as habitat management and restoration, tsunami modeling, monitoring, and marine resource management.

Continue reading “NOAA ocean mapping and reef surveys in the Mariana Islands”

Model Upgrade: Global Extratropical Surge and Tide Operational Forecast System Upgraded to Version Two

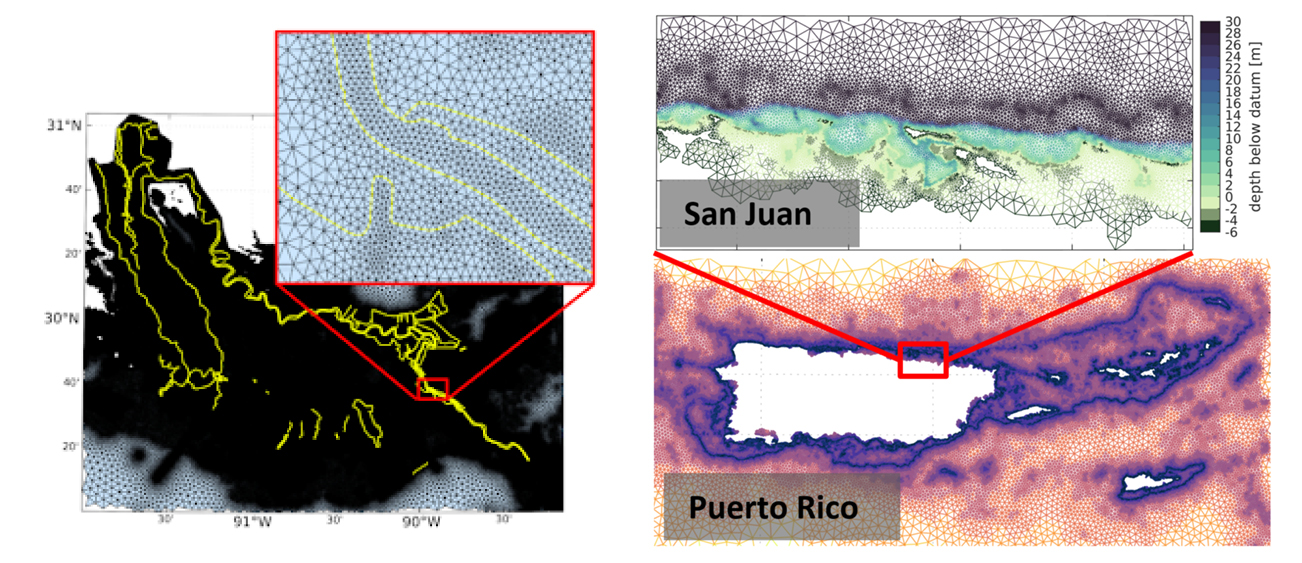
Screen captures of two new implementations of version two; federal levees along the Mississippi and flood plain inclusion for Puerto Rico.

In late July 2021, the Global Extratropical Surge and Tide Operational Forecast System (Global ESTOFS) upgrade to version two was implemented into operations on the National Weather Service’s (NWS) Weather and Climate Operational Supercomputing System (WCOSS). The modeling system provides forecast guidance for combined water levels caused by storm surge and tides globally, and is to our knowledge the highest resolution global operational storm surge modeling system available today. The forecast guidance from the model is used by forecasters at NWS Weather Forecast Offices (WFO) and the Ocean Prediction Center to generate their storm surge and flood forecasts during storms, including Nor’easters along the U.S. East Coast.

Continue reading “Model Upgrade: Global Extratropical Surge and Tide Operational Forecast System Upgraded to Version Two”

NOAA releases new visualization resources: Precision Navigation Data Gateway and Data Dashboard

NOAA’s Precision Marine Navigation (PMN) program released two new visualization resources. The first is a beta version Precision Marine Navigation Data Gateway map viewer allowing users to explore NOAA’s S-100 data services. Currently, the Data Gateway presents prototype surface current forecast guidance, but new layers will be added as they are developed. NOAA welcomes feedback on the beta version of the Data Gateway. Please submit all comments to marinenav.team@noaa.gov by March 1, 2021.

Continue reading “NOAA releases new visualization resources: Precision Navigation Data Gateway and Data Dashboard”

Introducing the Inland-Coastal Flooding Operational Guidance System (ICOGS)

Aerial imagery of inland-coastal flooding during Hurricane Harvey, 2017 in Houston, Texas.

Where the river meets the sea can be both a turbulent and vulnerable space, particularly during strong storms when heavy precipitation and storm surge intersect. This intersection is known as “compound inland-coastal flooding,” and until now, had not been carefully studied and implemented in forecasting centers for public guidance due to its inherent complexity. NOAA’s Office of Coast Survey and the Virginia Institute of Marine Science recently developed the Inland-Coastal Flooding Operational Guidance System (ICOGS), the world’s first three-dimensional integrated compound inland-coastal flooding guidance system.

Continue reading “Introducing the Inland-Coastal Flooding Operational Guidance System (ICOGS)”

Model Upgrade: Extratropical Surge & Tide Operational Forecast System (ESTOFS) is Now Global

An example of maximum forecast water levels (m MSL) from a forecast cycle of Global ESTOFS.

On November 24, an upgrade to Global ESTOFS was implemented to provide NWS forecasters with high resolution water level forecast guidance including storm tide (storm surge plus tides) for the entire globe. Global ESTOFS forecast guidance will be used by forecasters at WFOs and the Ocean Prediction Center (OPC) to generate their storm surge forecasts during winter storms including Nor’easters along the U.S. East Coast.

Continue reading “Model Upgrade: Extratropical Surge & Tide Operational Forecast System (ESTOFS) is Now Global”

NOAA bathymetric data helps scientists more accurately model tsunami risk within Barry Arm

Barry Glacier, Alaska.

In May of 2020, local geologists identified a steep, unstable slope that has the potential to become a tsunami-generating landslide in Barry Arm, a glacial fjord 60 miles east of Anchorage, Alaska. With documented cases of tsunami-generating landslides in Alaska including Lituya Bay in 1958 and Taan Fjord in 2015, this new hazard immediately caught the attention of state and federal partners who quickly joined forces to quantify the risk to those living and boating in Alaska’s Prince William Sound, specifically the communities of Whittier, Valdez, Cordova, Tatitlek, and Chenega.

Continue reading “NOAA bathymetric data helps scientists more accurately model tsunami risk within Barry Arm”