
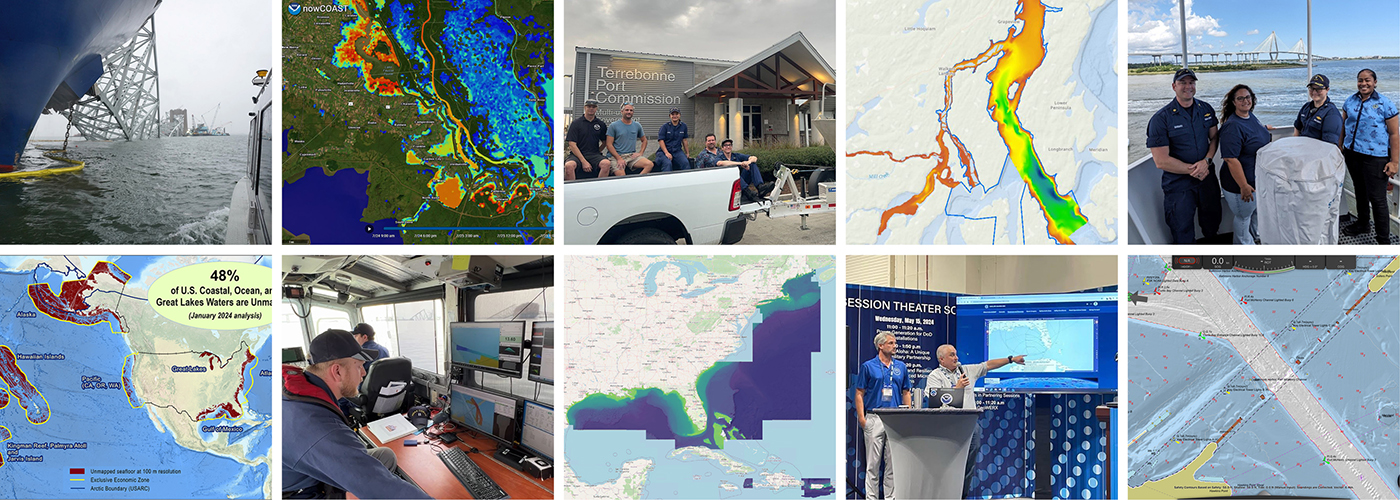
As we look ahead to continued progress in 2025, NOAA’s Office of Coast Survey is proud to share some highlights of the past year with you. We mounted successful emergency responses to reopen ports quickly and safely after hurricanes and a bridge collapse; completed a five-year process to transition to fully electronic navigational chart production; provided hands-on learning experiences for students aboard NOAA Ship Nancy Foster; and much more, all in service of delivering authoritative ocean and lakebed mapping information as the nation’s chartmaker.
We’ve organized these highlights in line with our Strategic Plan, which sets our course for the next four years towards the following goals:
- Expand and strengthen U.S. capabilities to acquire high-value ocean and coastal geospatial data.
- Deliver products and services that advance safe navigation, increase coastal resilience, and support data-driven decision making.
- Enhance and sustain a highly skilled workforce.
- Evolve Coast Survey’s systems and processes to improve timely product development and delivery.
Expanding acquisition of high-value ocean and coastal geospatial data
2024 Hydrographic Survey Projects
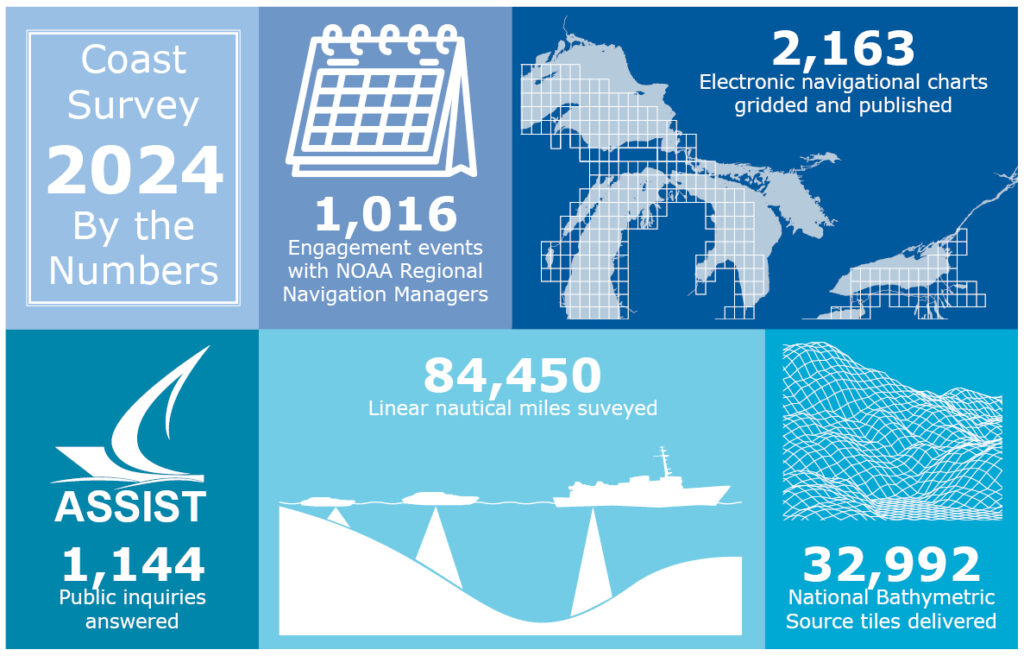
NOAA hydrographic survey ships, navigation response teams, and contractors began their survey season in March 2024. The ships and survey vessels collected 84,450 linear nautical miles of bathymetric data to support nautical charting, modeling, and research, but also collect other environmental data to support a variety of ecosystem sciences. Visit the ArcGIS StoryMap to learn more about our mapping projects.

Progress on Mapping U.S. Waters
The federal Interagency Working Group on Ocean and Coastal Mapping released the fifth annual report on progress made in mapping U.S. ocean, coastal, and Great Lakes waters. The report shows that 48% of U.S. waters remain unmapped as of January 2024, a 2% decrease in unmapped U.S. waters from 2023. The report shows that roughly 53,100 square nautical miles of new bathymetric data over previously unmapped areas was published by NOAA in 2023. The assessment of unmapped waters for calendar year 2024 is underway and will be published in spring 2025.

While recognizing a time lag between data acquisition and public access, Integrated Ocean and Coastal Mapping continued its efforts to coordinate bathymetric data acquisition among federal, state, academic, and non-government partners, particularly through regional campaigns such as Seascape Alaska and Lakebed 2030.
In October through early November 2024, a coordinated mapping mission took place along the north slope of Alaska aboard the U.S. Coast Guard Cutter Healy. The mission provided an opportunity for physical scientists to maximize data observations within a data-starved region in support of the regional mapping campaign, Seascape Alaska, acquire depth data in uncharted waters, deploy a series of oceanographic buoys, and provide at sea training on interdisciplinary scientific expeditions for junior scientists.
In support of the Lakebed 2030 regional campaign, NOAA continued collecting bathymetric data for benthic habitat mapping partners via the Great Lakes Restoration Initiative and held a strong presence at the annual conference in September 2024.
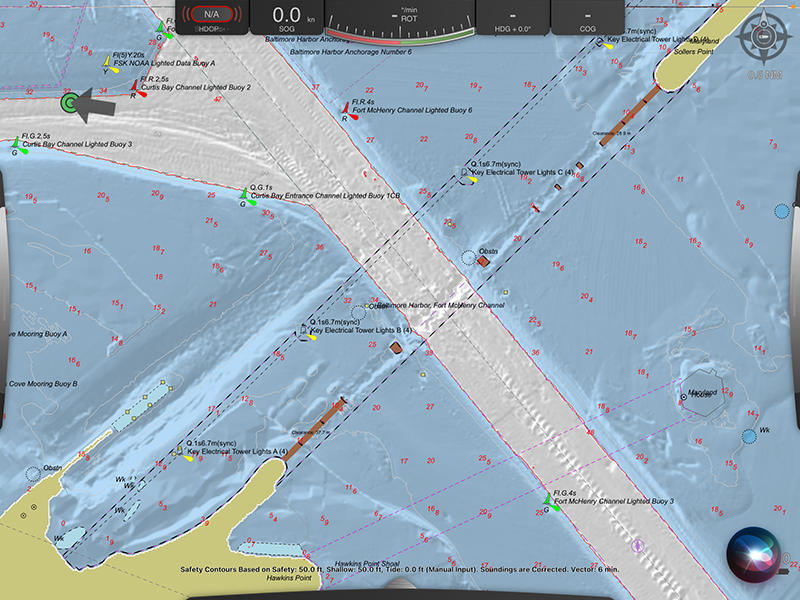
Francis Scott Key Bridge disaster response
In March 2024, NOAA’s Office of Coast Survey executed hydrographic surveys following cargo vessel Dali’s allision with the Francis Scott Key Bridge near the Port of Baltimore, Maryland, allowing the opening of safe alternate routes for shallow-draft vessels around the wreckage. The navigation response team surveyed the waters on the north and south side of the main channel as well as the width and height of the bridge span. The survey data allowed the U.S. Coast Guard to identify and open safe alternate routes for traffic, resuming the flow of commerce. Upon completing secondary survey operations, Coast Survey integrated the data rapidly into the NOAA Electronic Navigational Chart.
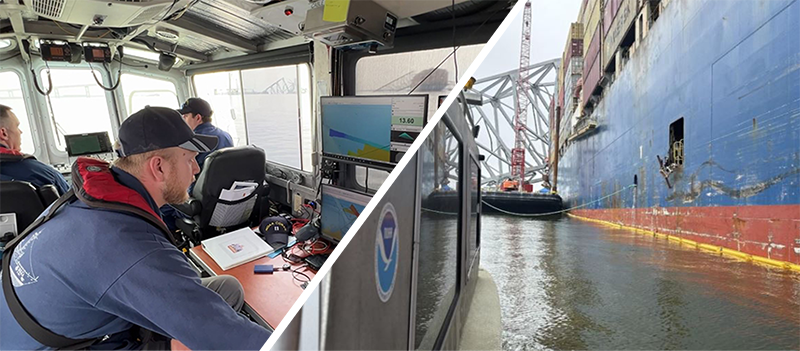
The revised chart, which includes both alternate channels, bridge features and clearances, and newly placed aids to navigation, was made available to the public. In June 2024, the navigation response team surveyed the areas around the former Francis Scott Key Bridge crossing where the remaining bridge parts were removed. The final survey identified bridge debris obstructions still on the nautical chart outside the main channel, providing 100% survey coverage around the former bridge crossing. Our teams assessed and processed the data, and then fully applied them to the electronic navigational charts. These developments were an important milestone in Coast Survey’s response to the Francis Scott Key Bridge disaster in Baltimore.
2024 Hurricane Response
The Office of Coast Survey’s Navigation Services Division mounted a response effort for Hurricane Francine, which made landfall as a Category 2 hurricane along the Louisiana coastline on September 11, 2024. NOAA’s navigation response teams and the Central Gulf Navigation Manager were on scene within 36 hours of the storm making landfall. Due to the efforts of field personnel and the support from remote data processors, the entire 34-nautical mile Houma Navigation Channel was cleared for navigation and several navigational aids were reported in real time as destroyed.
NOAA’s navigation response teams and South Florida Navigation Manager were also on scene in Tampa, Florida on Friday, September 27 after Hurricane Helene made landfall. In coordination with the United States Coast Guard and the U.S. Army Corps of Engineers, the teams identified corridors for safe navigation. Remote data processors rapidly reviewed and integrated the data into NOAA electronic navigational charts. Thanks to NOAA’s response efforts in the port, Tampa’s waterways were reopened with restrictions the following day.
The economic impact of the closure of the Port of Tampa Bay, including Seaport Manatee, due to Hurricane Helene was approximately $45 million per day, or about $135 million total. The Port of Tampa Bay provides approximately 45% of the fuel for all of Florida, including the jet fuel for MacDill Air Force Base, Tampa International Airport, and Orlando International Airport. Without fuel, the national security of the port was at risk, affecting the U.S. Coast Guard’s daily operation of repositioning aids to navigation and port security. Inbound cargo ships also were needed to provide building materials for repairing damaged homes and infrastructure, such as gypsum and cement.
In the aftermath of Hurricane Milton, the Office of Coast Survey conducted hydrographic survey operations to help reopen Port Tampa Bay and SeaPort Manatee. In the wake of the storm, the U.S. Coast Guard prioritized sending survey assets to SeaPort Manatee, allowing safe passage for cargo ships carrying fuel to the region. As part of the response effort, Coast Survey deployed two navigation response teams and issued a contract surveyor task order for a certified hydrographic survey, in cooperation with the U.S. Coast Guard and the U.S. Army Corps of Engineers. The navigation response teams were deployed on Friday, October 11 and the entrance channel to Tampa was reopened to restricted ship traffic and draft the following morning.
Delivering products and services that advance safe navigation, increase coastal resilience, and support data-driven decision making
Paper nautical chart production comes to an end
NOAA’s Office of Coast Survey successfully completed a five-year process to sunset all traditional paper nautical chart production. The final paper nautical chart was removed from the chart locator and archived on December 5, 2024. Over these past five years, NOAA worked to ease the transition to NOAA electronic navigational charts while continuing to support safe navigation. This includes the development of the online NOAA Custom Chart application, enabling users to create their own charts from the latest NOAA electronic navigational chart data.

While the majority of our users access our navigation data digitally through NOAA electronic navigational charts, large-format paper charts are still useful for planning, situational awareness, and as a backup in the event of device malfunctions. Users will still be able to generate these large-format paper charts through the NOAA Custom Chart application. This application pulls directly from our most up-to-date electronic navigational chart data and allows the user to choose the exact scale, area, paper size, and other dimensions to fit their needs, generating a portable document format file for printing.
To help users in creating nautical charts using the NOAA Custom Chart application, NOAA developed and published a technical memorandum, Best practices for creation and maintenance of ENC-derived paper nautical charts.
NOAA implements new nautical chart corrections website and updates NOAA Custom Chart application
NOAA’s Office of Coast Survey developed a new website to easily show the most recent corrections to NOAA’s electronic navigational charts, or NOAA ENC, along with a new version of the NOAA Custom Chart application. The NOAA Navigation Updates website is designed to allow for more choices when searching for chart corrections. Users can search for chart corrections by U.S. Coast Guard district, specific NOAA ENC, or user-defined geometries. Searches can also be defined by time period, allowing queries to show results up to two years prior. The new website also allows users to search for updates based on user-defined nautical charts by uploading a personal chart catalog created in the NOAA Custom Chart application, an online application that enables users to create their own customized nautical charts directly from the latest official NOAA ENC data.

In addition to this new search feature, the NOAA Custom Chart application was updated with visual and technical improvements ranging from reorganizing the help and feedback panel to adding new output paper chart sizes.
National Bathymetric Source buildout
The National Bathymetric Source team is building and maintaining a seamless, authoritative high-resolution model of the seafloor in U.S. waters compiled from the best available source data. This project enables the creation of next-generation nautical charts while also providing support for modeling, industry, science, regulation, and public curiosity.
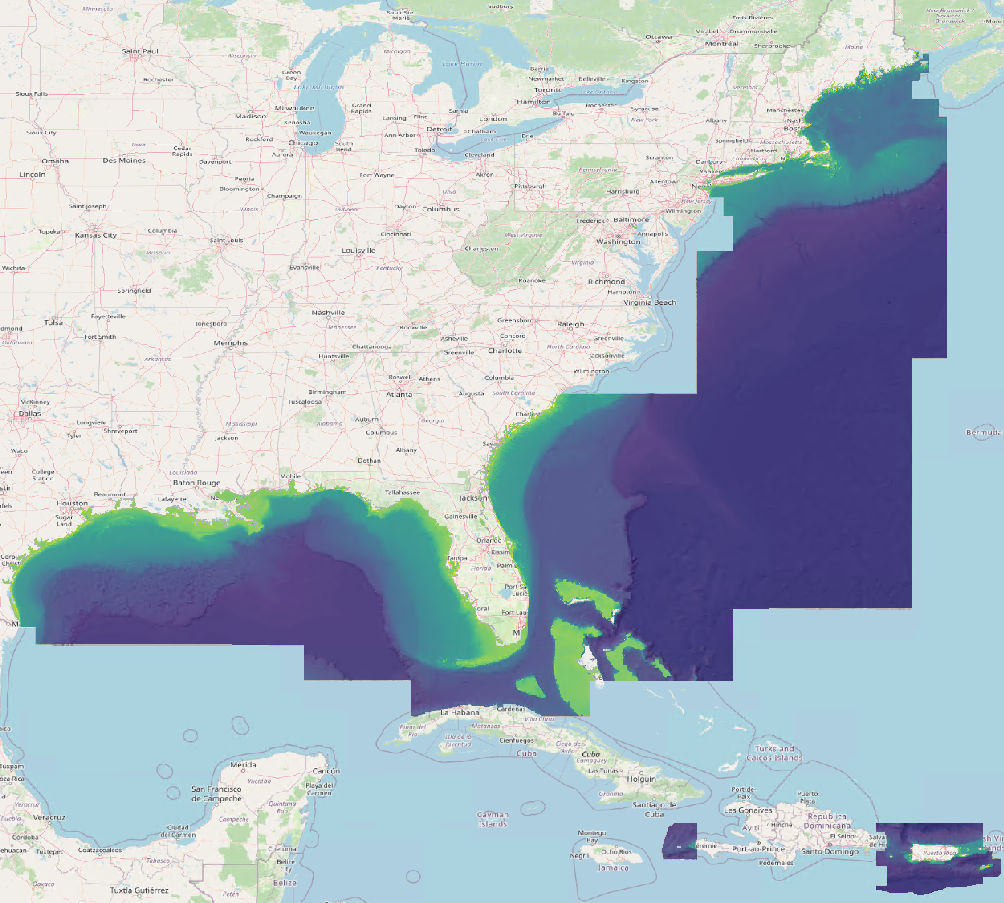
National Bathymetric Source coverage is fully built out in the Northeast, Southeast, Gulf Coast, and U.S. Caribbean including BlueTopo, bathymetry, and electronic navigational chart products. We expect to have the East Coast completely built in spring 2025, after which we will move on to Alaska, the Great Lakes, the West Coast, and the Pacific.
Precision Marine Navigation bathymetry layers expand to new waterways
In 2024, bathymetric surface, or S-102, test products were made available in Boston, Massachusetts; Charleston, South Carolina; and Savannah, Georgia. NOAA’s regional navigation managers for these locations have been working closely with the pilots, portable pilot unit manufacturers, and other local mariners on how to use this new test S-102 data.
After the Francis Scott Key Bridge collapse, the National Bathymetric Source team worked with surveys provided by NOAA’s navigation response teams, U.S. Army Corp of Engineers, and the port authority to provide S-102 data for the approach to Baltimore and assist pilots and other mariners in navigating around the rubble during clean up efforts.
Forecast System Improvements
The Office of Coast Survey extends forecast guidance by 50% for the Surge and Tide Operational Forecast System. The system delivers integrated coastal ocean data including; water level, water current, salinity, and water temperature through forecast models improving the nation’s coastal resilience and navigational safety. New updates to the system implemented in 2024 enhance model performance, resolution, and coverage. The global version of the system has a new feature that removes systematic errors in the model’s water level forecast guidance at tide station locations.
The model was upgraded by incorporating the latest high temporal resolution NOAA Global Forecast System outputs, and improved topography/bathymetry. The three-dimensional component for the Atlantic basin now has major improvements to the underlying watershed data; satellite altimetry data usage; referencing the model to the geoid; and forecast guidance up to 96 hours into the future, doubling the forecast guidance. This new addition improves accuracy and expands model coverage into the Gulf of St. Lawrence, and now includes the entire Atlantic coast of the United States, the Gulf Coast, and the Caribbean Sea down to the north coast of South America.
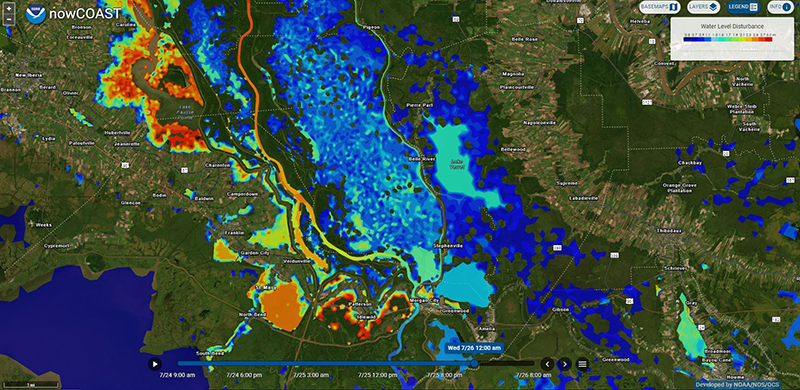
New version of NOAA’s nowCOAST
We released a new version of nowCOAST™ was released in 2024. The application covers all U.S. coastal waters, including the Great Lakes, and is a cloud-based web mapping portal for real-time coastal observations, forecasts, and warnings for the maritime community. The portal serves as a “one-stop” website for real-time coastal meteorological, oceanographic, and hydrologic observations from various internet sites within and outside of NOAA, including NOAA forecasts.
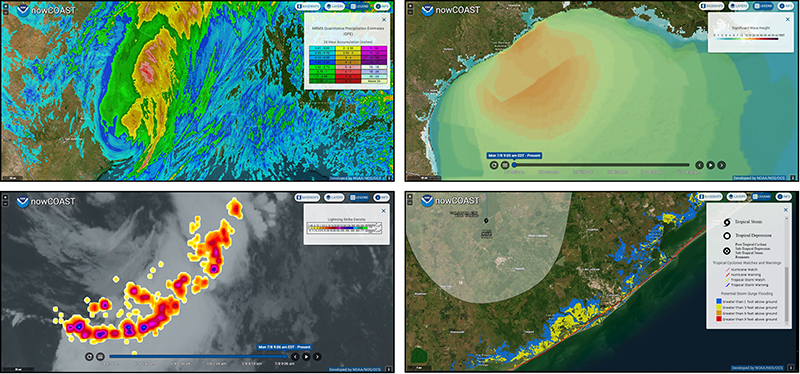
The new version of nowCOAST added Geostationary Operational Environmental Satellite imagery, radar, and precipitation estimates from the National Weather Service, and National Severe Storms Laboratory up to 72 hours in advance; beach and surf zone forecasts, including rip current risk levels; and lightning strike density data. The portal is designed as a planning aid for recreational and commercial mariners, coastal managers, HAZMAT responders, marine educators, and researchers, who can all discover and display real-time information for their particular needs and geographic area of interest.
Enhancing and sustaining a highly skilled workforce
NOAA Center of Excellence for Operational Ocean and Great Lakes Mapping
In 2023, NOAA established the Center of Excellence for Operational Ocean and Great Lakes Mapping with designated funding from Congress to address significant unmet needs in NOAA’s statutory and treaty-based hydrographic mapping responsibilities. The Center will ensure state-of-the-art equipment aboard the NOAA fleet has the support necessary to collect quality data by ensuring the operators are properly trained and the systems are well maintained. Since its establishment in 2023, the Center has:
- Created and implemented a robust training program, piloting courses for over 30 NOAA, U.S. Marine Corps, and National Geospatial-Intelligence Agency personnel, as well as providing at-sea experience for 27 university students.
- Developed a business plan to provide technical support to operators in the field.
- Engaged industry and academic partners to ensure a true public-private partnership, starting with the University of New Hampshire and 50+ industry partners.
- Successfully onboarded three full-time staff members in December 2024, and will onboard a NOAA Corps officer in January 2025, to support the overall direction and leadership of the Center.
NOAA participates in International Hydrographic Organization initiatives
The International Hydrographic Organization, or IHO, 8th Council Meeting was held in Monaco in October 2024. NOAA was represented by the Office of Coast Survey Director and U.S. National Hydrographer Rear Adm. Benjamin Evans who led the U.S. delegation. The IHO Council meets every year and serves as the executive oversight body for member states to guide the work of the IHO.

This meeting saw representatives from 44 of the 100 member states coordinate the IHO’s work programs. Last year, key discussions concerning the S-100 hydrographic data model standard developments and timelines took place. The data model was developed to cater to future demands for digital products and services supporting safe navigation. Major milestones and deliverables over the next two years are expected, with the next generation of maritime navigation emerging globally as the world approaches the international mandate for S-100 navigation beginning in 2026.
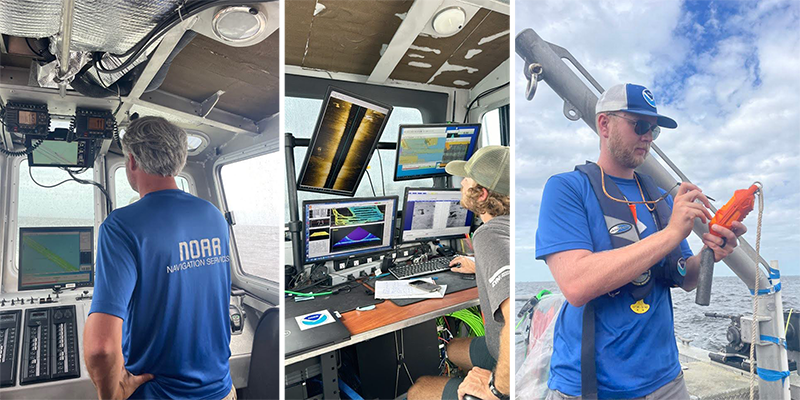
Students collect hydrographic survey data as part of their course work
From June 24 to July 21, NOAA’s Center of Excellence for Ocean and Great Lakes Mapping partnered with seven academic institutions to provide undergraduate and graduate students, and their academic advisors the opportunity to sail aboard NOAA Ship Nancy Foster on student-focused mapping cruises. The primary goal of these cruises is to serve as a training opportunity for students, and secondarily to continue collecting data in a National Ocean Mapping, Exploration and Characterization priority area on the Blake Plateau, about 60 nautical miles east of Charleston, South Carolina. The seven institutions represented were Cape Fear Community College, College of Charleston, Northwestern Michigan College, Stockton University, University of New Hampshire, University of South Florida, and University of Southern Mississippi.
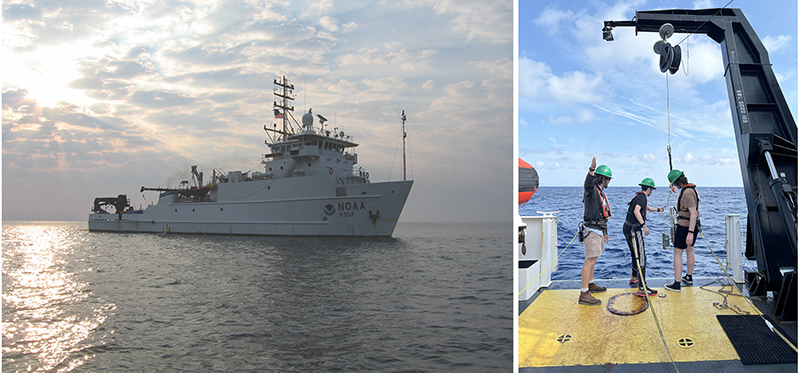
Over the course of three, seven to eight-day legs, 25 students, and two academic staff members sailed aboard the ship. The students all have academic backgrounds in mapping and other marine science programs. Their previous at-sea experience ranged from having never been to sea to having sailed numerous times on mapping cruises. The cruise featured valuable hands-on experience and learning useful surveying techniques including data collection and processing, experiencing marine life and life at sea.
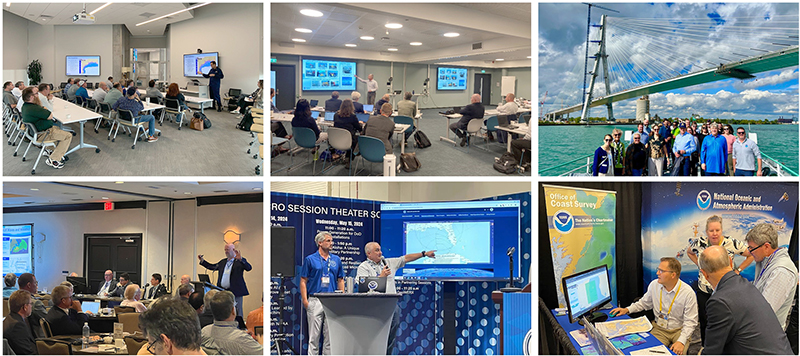
Stakeholder and Partner Engagement Events
NOAA’s Office of Coast Survey could not fulfill our mission without our federal, state, and local partners, and robust input from academia, industry, and the public. We also maintain and build strong relationships with hydrographic offices worldwide to ensure our data, products, and services will be interoperable around the globe. See below for a sample of our many productive external engagements in 2024!
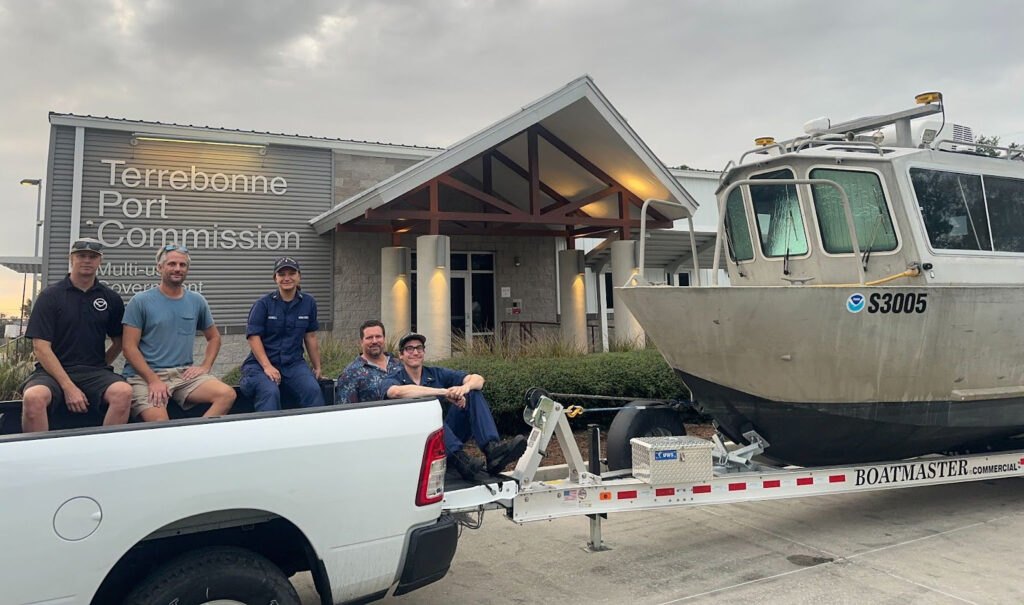
- Stakeholder engagement in Texas (March 2024)
- Spring HSRP (March 202)
- Engineering Expo (June 2024)
- Radio Technical Commission for Maritime Service’s 2024 annual assembly and conference and the International Association of Marine Aids to Navigation and Lighthouse Authorities conference (June 2024)
- Canadian Hydrographic Conference/U.S.-Canada Regional Hydrographic Conference (June 2024)
- Arctic Regional Hydrographic Commission (September 2024)
- Lakebed 2030 (September 2024)
- Fall HSRP (October 2024)
- American Pilots Association Convention (November 2024)
Evolving Coast Survey’s systems and processes to accelerate product development and delivery
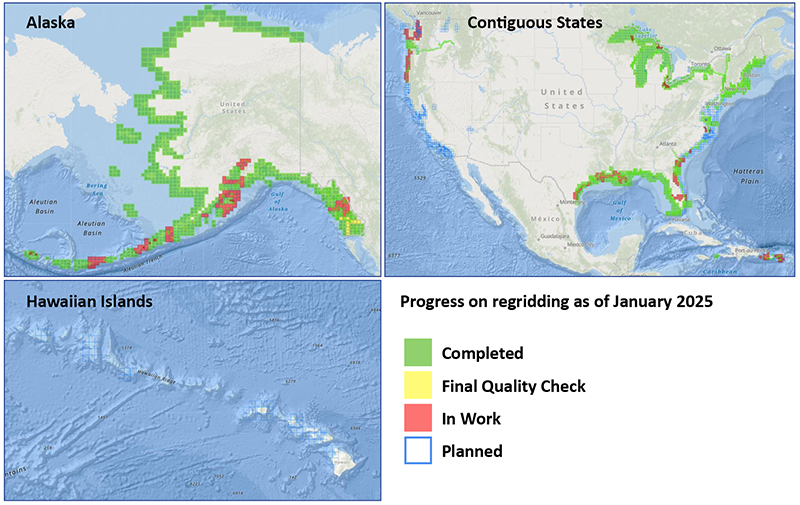
NOAA makes progress on re-gridding electronic navigational charts
In 2024, Coast Survey continued working on transitioning NOAA’s electronic navigational charts from the footprints and scales of the original paper charts to a regular grid. This is enhancing NOAA chart coverage to create new larger scale and more detailed electronic navigational chart cells, and to standardize the scales and coverage. It is also essential to support the NOAA Custom Chart application and to transition NOAA’s charts to the next generation S-101 electronic navigational chart standard which will come into use in 2026. In 2024, Coast Survey’s gridding team published a total of 2,163 new gridded cells, bringing the completion percentage to 66.5%. Once complete, the new electronic navigational chart suite will total 6,945 new cells. Coast Survey is now on track to complete this effort by the end of 2026, shortening the project timeline by about ten years.
NOAA updates hydrographic survey specifications and ocean mapping documents
The Hydrographic Surveys Specifications and Deliverables, or HSSD, was published in April 2024, marking a full-scale modernization of the document and its largest overhaul in more than 20 years. The document was updated recently based on valuable feedback from the NOAA field units using the new HSSD for their 2024 survey projects. This release represents a paradigm shift for NOAA’s hydrographic survey specifications – the capability now exists for midseason updates enabling critical requirements to be codified rapidly, and delivered back to the field. The latest version is available on our website, in both PDF and portable HTML formats.
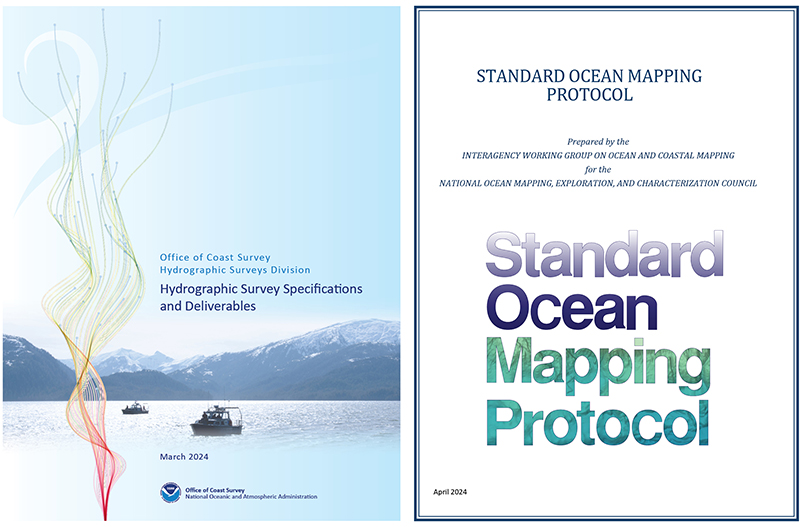
In addition to the HSSD, last year the federal Interagency Working Group on Ocean and Coastal Mapping, or IWG-OCM, announced the release of the first Standard Ocean Mapping Protocol, or SOMP. The SOMP is a standardized technical protocol for the acquisition, processing, and archiving of ocean and coastal mapping data. The key objective of the protocol is to improve consistency in how ocean and coastal mapping data is collected and stewarded so that data from many sources can be shared and integrated. The protocol was developed in support of the National Strategy for Ocean Mapping, Exploring, and Characterizing the United States Exclusive Economic Zone goals. This protocol was written by a team of 18 interagency members and subject matter experts in the fields of ocean science and technology. IWG-OCM built the protocol from existing mapping standards and best practices developed by the ocean and coastal mapping community.
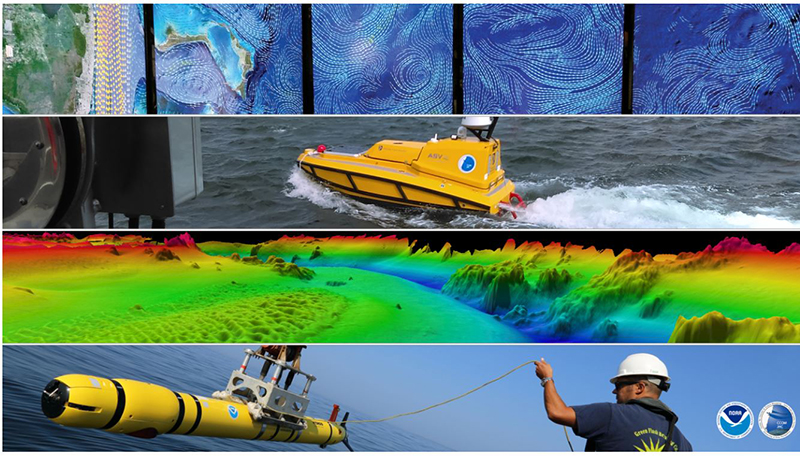
Uncrewed system operations
In 2024, in conjunction with traditional hydrographic survey platforms, NOAA’s Office of Coast Survey conducted hydrographic operations utilizing uncrewed surface vehicles on three different projects in Alaska, the Gulf of Maine, and offshore Louisiana. In Kotzebue Sound, Alaska, a Coast Survey contractor utilized an optionally crewed hydrographic launch to leverage the efficiencies and capabilities of both a crewed and uncrewed hydrographic survey launch.
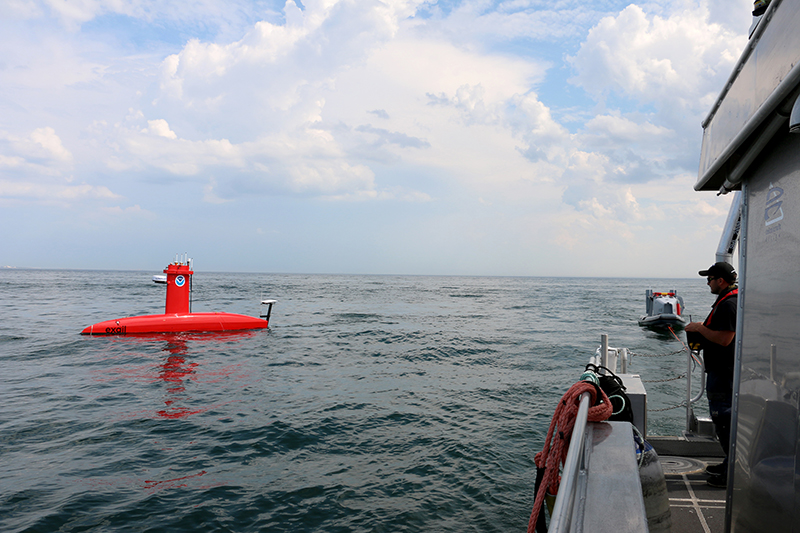
In partnership with the University of New Hampshire and NOAA’s Office of Marine and Aviation Operations, Coast Survey conducted a “Dual Drix” project in the Gulf of Maine, where two Exail Drix vehicles conducted multibeam survey operations without nearby crewed surface vessel support. Offshore of Calcasieu, Louisiana, a Coast Survey contractor utilized an Exail Drix vehicle that was equipped with synthetic aperture sonar (SAS) in addition to a multibeam echosounder to collect SAS imagery data in conjunction with the multibeam data. This was a first for Coast Survey—collecting SAS imagery on an uncrewed surface vehicle on a Coast Survey task order. Coast Survey is excited to increase utilization of emerging technologies such as uncrewed systems in hydrographic data collection and processing.
Looking forward to 2025
NOAA’s Office of Coast Survey looks forward to an exciting 2025, including the continuation of cross-office and interagency engagement as the Ocean Service continues to holistically build out its foundational data framework, mapping capacity, and modeling ecosystem.