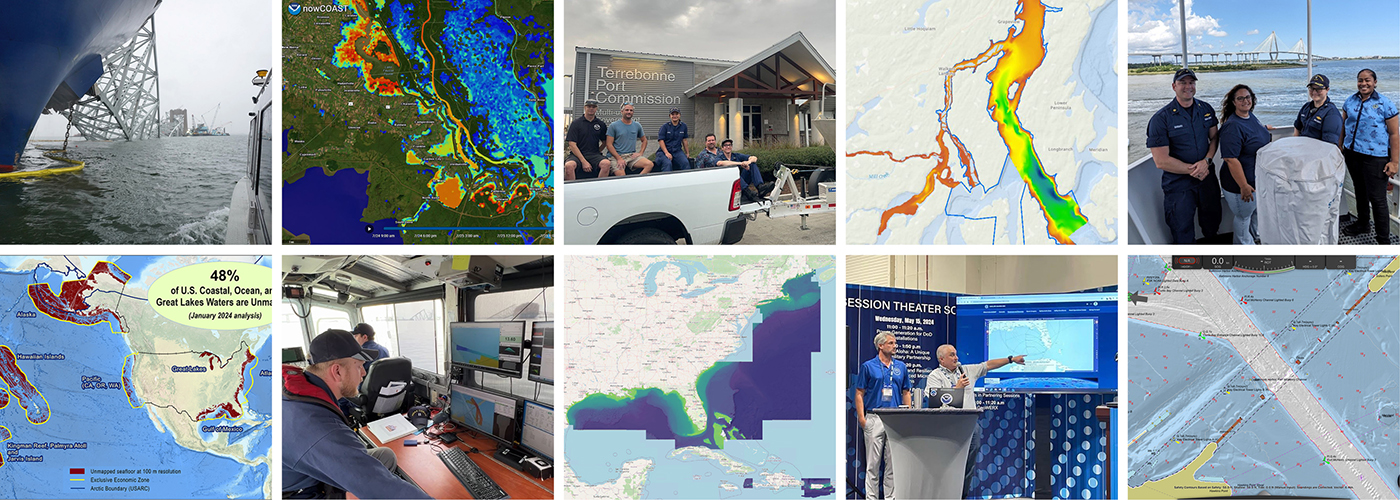
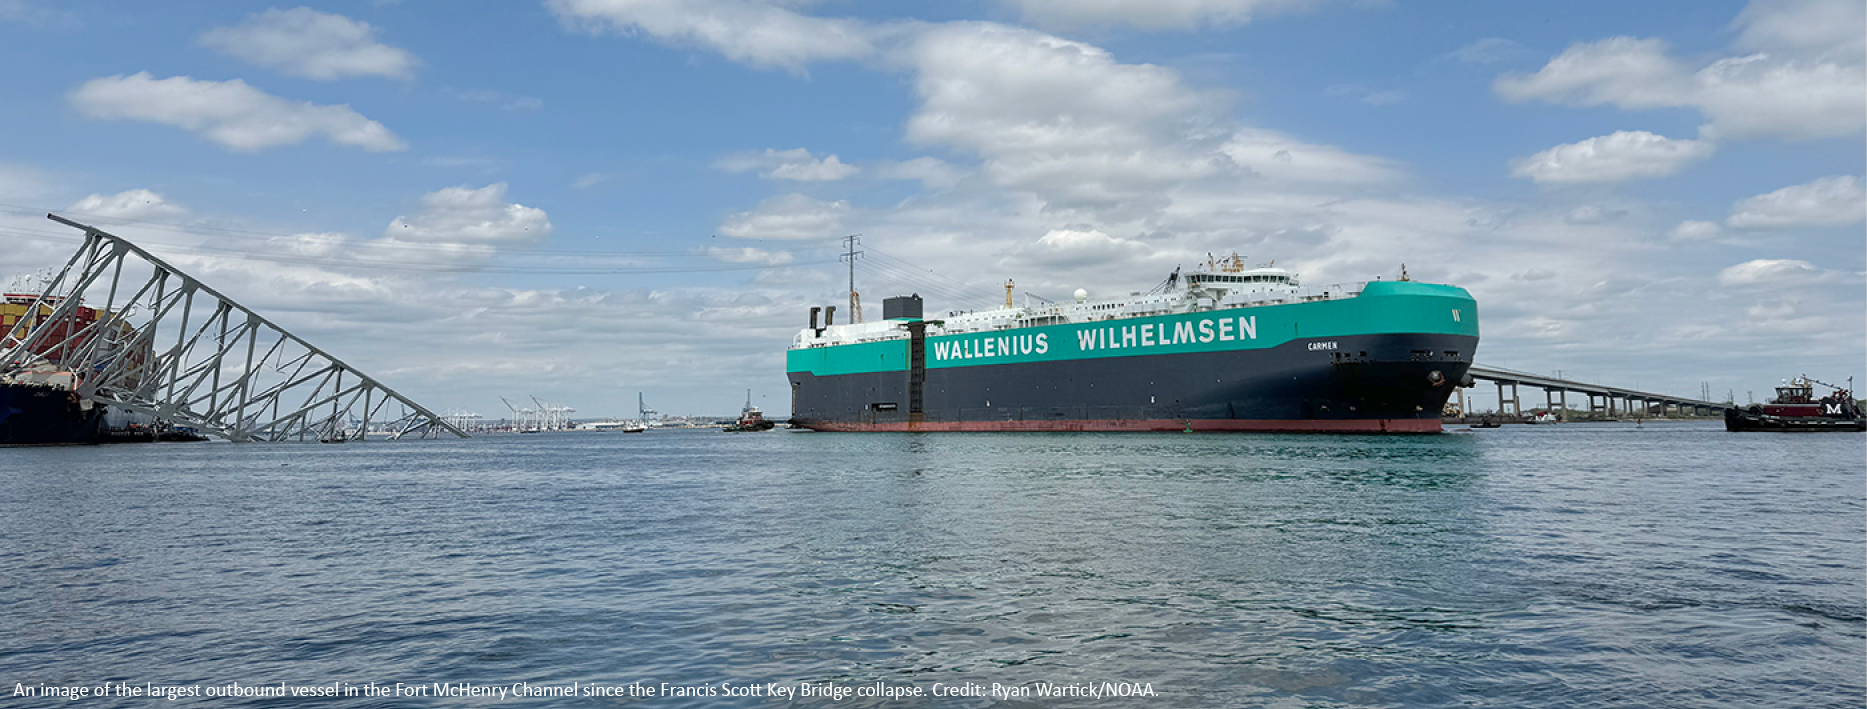
The Office of Coast Survey’s ongoing response to the Francis Scott Key Bridge disaster

An image of the largest outbound vessel in the Fort McHenry Channel since the Francis Scott Key Bridge collapse.

On Tuesday, March 26, 2024, the 984-foot M/V DALI allided with the Francis Scott Key Bridge near Baltimore, Maryland, sending the bridge tumbling into the Patapsco River, resulting in the tragic loss of six construction workers, and triggering a local, state, and federal response. Large sections of the bridge’s structure lay across the main shipping channel into the Port of Baltimore closing the deepest shipping lane into and out of the port, and resulting in an estimated loss of $15 million in daily economic activity for the area. All shipping traffic was diverted from the area, enabling first responders to conduct high-priority rescue and recovery operations and allowing highly trained salvage crews to begin the arduous task of removing bridge wreckage. Due to the amount of debris in the water, it was evident that salvage operations would take some time, and the priority at the time was to open the port for at least some vessel traffic.

Continue reading “The Office of Coast Survey’s ongoing response to the Francis Scott Key Bridge disaster”

A look back at 2023 and the Office of Coast Survey’s significant activities throughout the year

An image of a rocky coastline and low clouds with the title Coast Survey Year in Review, superimposed over it.

NOAA’s Office of Coast Survey is reflecting on a successful and remarkable 2023! We completed many significant activities with meaningful impacts. As we look ahead to more progress in 2024, we are proud to share some highlights of the past year in our Coast Survey Year in Review ArcGIS StoryMap.

Continue reading “A look back at 2023 and the Office of Coast Survey’s significant activities throughout the year”

Bringing nautical charts of the Erie Canal into the digital era

The construction of the Erie Canal was one of 19th Century America’s most significant feats of engineering. Built between 1817 and 1825, the canal provided a water route from Albany to Buffalo, New York, nearly 363 miles to the west. The Canal connected the Hudson River with the Great Lakes via parts of the Mohawk River, through various land cuts and natural lakes. The New York State Public Works Department and the US War Department’s Corps of Engineers began geographically documenting the canal’s route with maps and nautical charts beginning in 1917. The Department of Commerce’s National Oceanic and Atmospheric Administration took ownership of the charts in the early 1970’s and has maintained and updated them for over 50 years. Currently, these charts are undergoing changes to usher them into the digital era of electronic navigational charts.

Check out our digitizing the Erie Canal ArcGIS StoryMap linked here or click the image below!

An image showing the Erie Canal at Waterford, New York during a festival.
An image showing the Erie Canal at Waterford, New York during a festival. Credit: Erie Canalway National Heritage Corridor/Halldor K. Sigurdsson.

Have it your way – creating customized nautical charts using the latest data

An image showing the output of the NOAA Custom Chart application with a chart covering the western side of the Chesapeake Bay.

Nautical charts have always contained a great amount of information – even more so with electronic navigational charts. This information is constantly being updated, necessitating the need to keep your nautical chart suite as current as possible. The Office of Coast Survey’s online NOAA Custom Chart application enables users to create nautical charts directly from the latest official NOAA electronic navigational chart (NOAA ENC®) data. Users now have the ability to create their own nautical charts using individually set parameters, and then save this custom nautical chart as a file that can be viewed or printed.

Continue reading “Have it your way – creating customized nautical charts using the latest data”