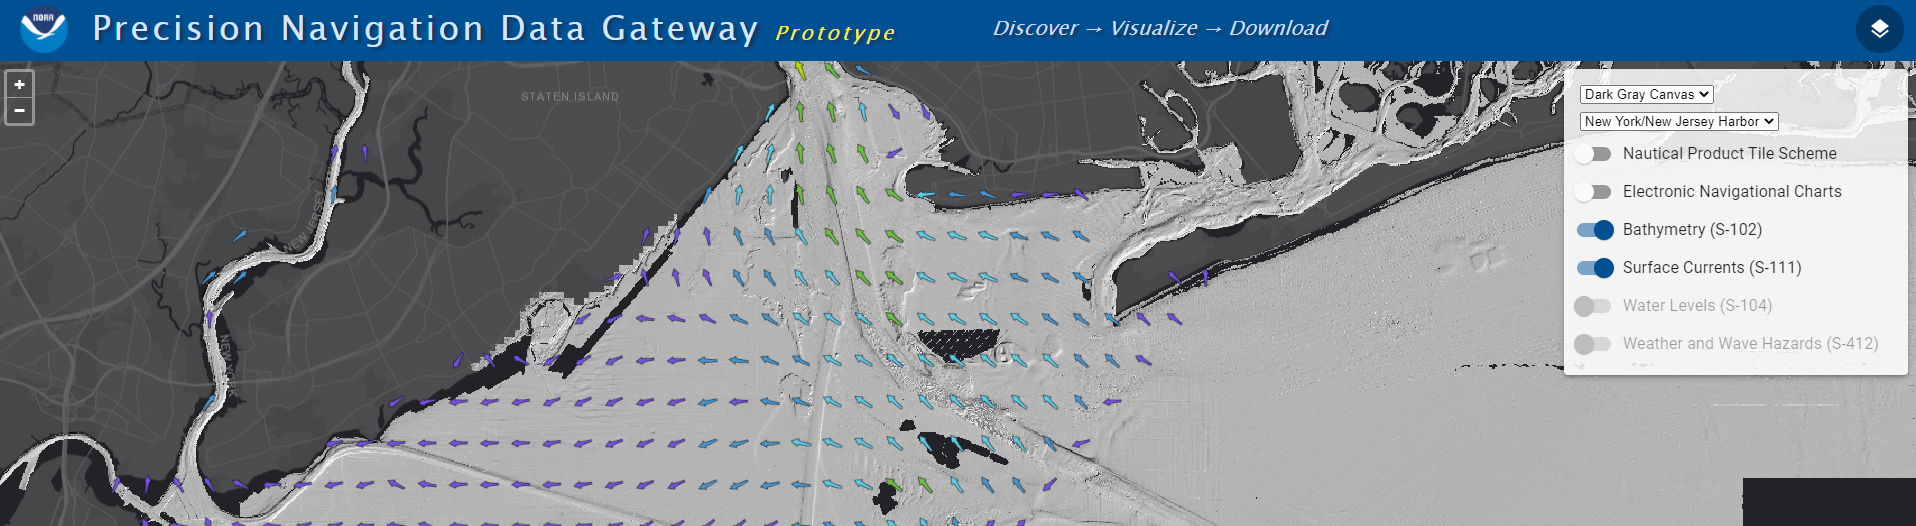
NOAA’s Precision Marine Navigation (PMN) program released two new visualization resources. The first is a beta version Precision Marine Navigation Data Gateway map viewer allowing users to explore NOAA’s S-100 data services. Currently, the Data Gateway presents prototype surface current forecast guidance, but new layers will be added as they are developed. NOAA welcomes feedback on the beta version of the Data Gateway. Please submit all comments to marinenav.team@noaa.gov by March 1, 2021.
Continue reading “NOAA releases new visualization resources: Precision Navigation Data Gateway and Data Dashboard”Introducing the Inland-Coastal Flooding Operational Guidance System (ICOGS)
Where the river meets the sea can be both a turbulent and vulnerable space, particularly during strong storms when heavy precipitation and storm surge intersect. This intersection is known as “compound inland-coastal flooding,” and until now, had not been carefully studied and implemented in forecasting centers for public guidance due to its inherent complexity. NOAA’s Office of Coast Survey and the Virginia Institute of Marine Science recently developed the Inland-Coastal Flooding Operational Guidance System (ICOGS), the world’s first three-dimensional integrated compound inland-coastal flooding guidance system.
Continue reading “Introducing the Inland-Coastal Flooding Operational Guidance System (ICOGS)”Model Upgrade: Extratropical Surge & Tide Operational Forecast System (ESTOFS) is Now Global
On November 24, an upgrade to Global ESTOFS was implemented to provide NWS forecasters with high resolution water level forecast guidance including storm tide (storm surge plus tides) for the entire globe. Global ESTOFS forecast guidance will be used by forecasters at WFOs and the Ocean Prediction Center (OPC) to generate their storm surge forecasts during winter storms including Nor’easters along the U.S. East Coast.
Continue reading “Model Upgrade: Extratropical Surge & Tide Operational Forecast System (ESTOFS) is Now Global”NOAA bathymetric data helps scientists more accurately model tsunami risk within Barry Arm
In May of 2020, local geologists identified a steep, unstable slope that has the potential to become a tsunami-generating landslide in Barry Arm, a glacial fjord 60 miles east of Anchorage, Alaska. With documented cases of tsunami-generating landslides in Alaska including Lituya Bay in 1958 and Taan Fjord in 2015, this new hazard immediately caught the attention of state and federal partners who quickly joined forces to quantify the risk to those living and boating in Alaska’s Prince William Sound, specifically the communities of Whittier, Valdez, Cordova, Tatitlek, and Chenega.
Continue reading “NOAA bathymetric data helps scientists more accurately model tsunami risk within Barry Arm”NOAA Coast Survey’s new strategy supports charting mandates and broader seafloor mapping
This week, NOAA’s Office of Coast Survey released the Mapping U.S. Marine and Great Lakes Waters: Office of Coast Survey Contributions to a National Ocean Mapping Strategy. This report is part of NOAA’s ongoing commitment to meet core surveying and nautical charting mandates while supporting broader needs to fill gaps in seafloor mapping and environmental sciences.
Continue reading “NOAA Coast Survey’s new strategy supports charting mandates and broader seafloor mapping”NOAA improves coastal resilience tools for U.S. Pacific Islands vulnerable to natural disasters
By Jack Riley and Sergey Vinogradov, Ph.D.
The Pacific Ocean is the largest and deepest of Earth’s oceanic divisions. It extends from the Arctic Ocean in the north to the Southern Ocean in the south and is bound by the continents of Asia and Australia in the west and the Americas in the east. Most of the U.S. Pacific territories are located in the northern half of the Pacific Ocean and are among the Pacific Islands that are highly exposed to natural disasters. As part of NOAA’s coastal resilience efforts, the National Ocean Service (NOS) is developing better tools to define changes in water level related to tropical cyclones and other weather related conditions. This work is part of the global effort to develop disaster risk assessment tools and practical technical applications to reduce and mitigate coastal countries’ vulnerability to natural disasters.
Continue reading “NOAA improves coastal resilience tools for U.S. Pacific Islands vulnerable to natural disasters”Building the National Bathymetry
By Katrina Wyllie and Glen Rice
The National Bathymetric Source (NBS) project creates and maintains high-resolution bathymetry composed of the best available data. This project enables the creation of next-generation nautical charts while also providing support for modeling, industry, science, regulation, and public curiosity.
Continue reading “Building the National Bathymetry”Do you believe in miracles? New exhibit highlights National Weather Service support of 1980 Winter Olympic Games
This week, as part of the 40th anniversary of the XIII Olympic Winter Games in 1980, the Lake Placid Olympic Museum launched the exhibit, Foretelling the Future – The National Weather Service at the 1980 Olympic Winter Games. These Olympic Games stand out in our collective memory as the venue for the “miracle on ice,” when the U.S. hockey team beat the 4-time Olympic champions, the Soviet Union. Little do most people know, however, another kind of team was pulling off a small miracle of their own at these games.

nowCOAST® offers new Gulf of Maine, Chesapeake Bay forecast services
NOAA’s nowCOAST®, a GIS-based online web mapping service that provides frequently updated weather and ocean observations, analyses, imagery, and ocean model forecast guidance, along with weather watches and warnings and forecasts, now provides maps of oceanographic forecast guidance from the National Ocean Service (NOS) 3-D operational forecast modeling system for the Gulf of Maine (GoMOFS) and NOS forecast guidance of the marine pathogen, Vibrio Vulnificus (Vv), for the Chesapeake Bay via two new map services and map viewer. Continue reading “nowCOAST® offers new Gulf of Maine, Chesapeake Bay forecast services”
NOAA Ship Thomas Jefferson tests drone use for shoreline mapping
By, Lt. j.g. Matt Sharr, NOAA, and Lt. Charles Wisotzkey, NOAA
NOAA’s Office of Coast Survey and the National Geodetic Survey (NGS) recently conducted operational tests of small unmanned aerial systems — or drones — on board NOAA Ship Thomas Jefferson in support of survey operations conducted along the south coast of Puerto Rico. The tests show the potential of imagery from low-cost off-the-shelf drones to meet NOAA survey specifications for near-shore and shoreline feature mapping. This could replace traditional shoreline verification and mapping techniques used by NOAA hydrographic survey field units. Potential benefits of using drones for shoreline mapping include: improved data collection efficiency compared to data collection from small skiffs; more accurate feature investigation than traditional techniques; and, most importantly, removal of personnel from potentially dangerous situations (i.e. survey in close proximity to features being mapped). Continue reading “NOAA Ship Thomas Jefferson tests drone use for shoreline mapping”