
NOAA’s Precision Marine Navigation (PMN) program released two new visualization resources. The first is a beta version Precision Marine Navigation Data Gateway map viewer allowing users to explore NOAA’s S-100 data services. Currently, the Data Gateway presents prototype surface current forecast guidance, but new layers will be added as they are developed. NOAA welcomes feedback on the beta version of the Data Gateway. Please submit all comments to marinenav.team@noaa.gov by March 1, 2021.
In the summer of 2020, NOAA released prototype PMN data for testing and feedback by industry partners and software developers. This data is designed to be machine-to-machine readable and be automatically ingested and displayed into navigation systems. NOAA recognized that it also needed to develop a web mapping application that users can employ to discover and visualize the PMN S-100 product suite as NOAA releases them. The Data Gateway map viewer allows users to see what type of data is available, where it is available, and uses the International Hydrographic Organization (IHO) S-100 portrayal rules to demonstrate how the data may be displayed on navigation systems.
As Project Manager, John G.W. Kelley describes it,
“The Data Gateway map viewer is an important step in making the maritime community aware of NOAA S-100 products and NOAA’s commitment to enable precision marine navigation in U.S. waters. “
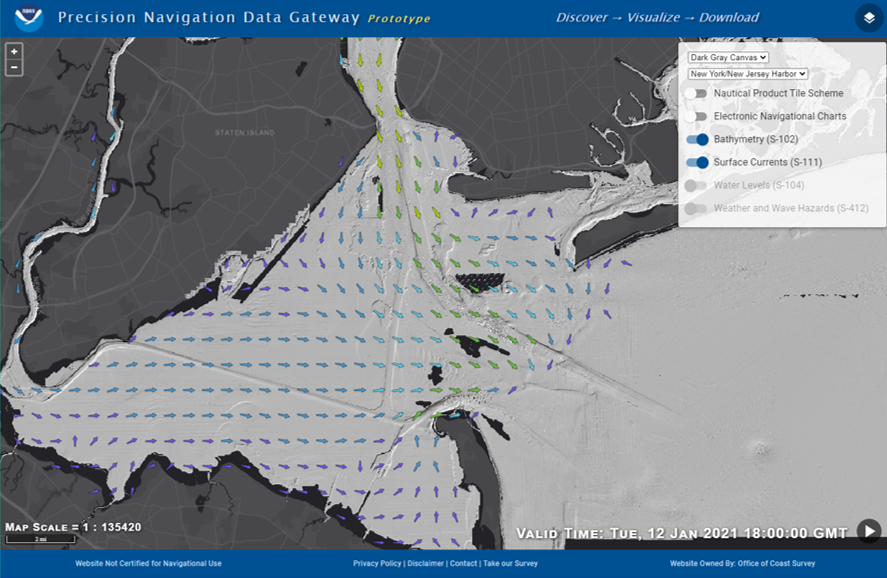
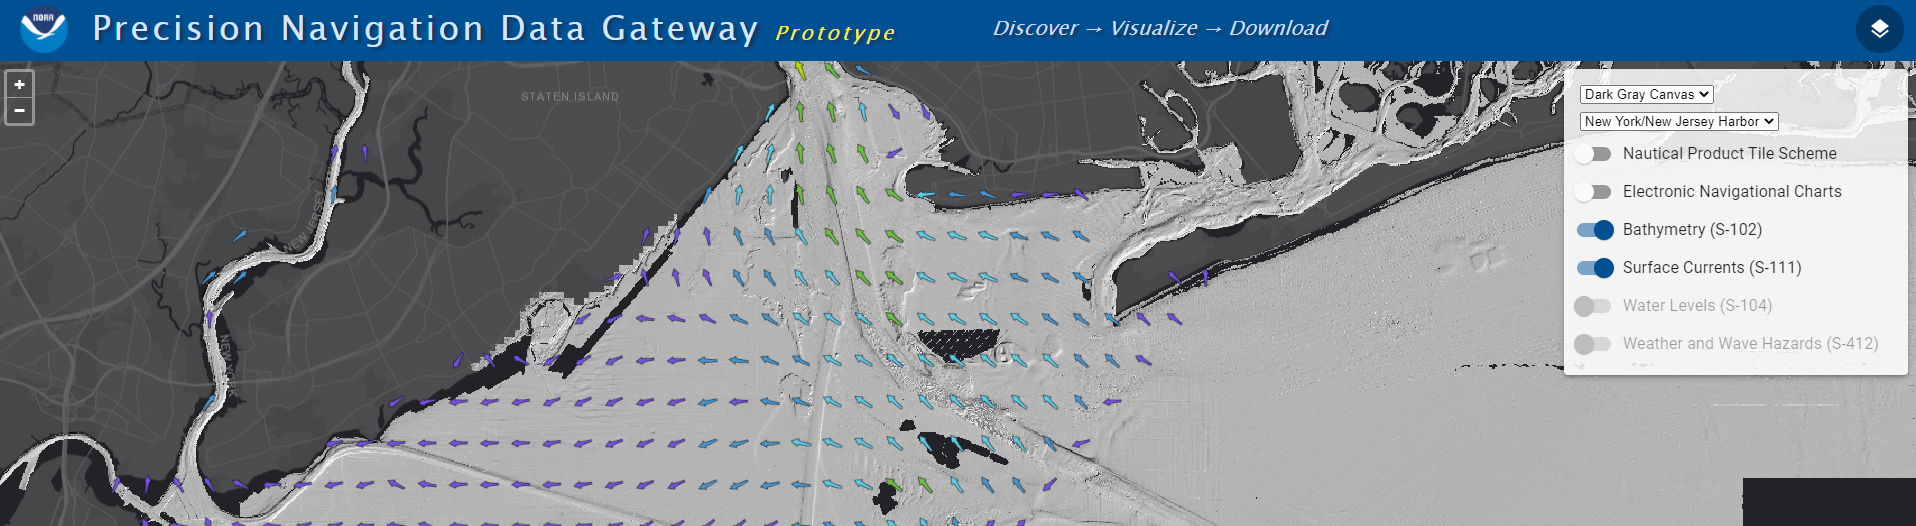
Through the PMN program, NOAA is prototyping data leveraging the S-100 format for operationalization in navigation systems. Currently the Data Gateway map viewer presents forecast guidance of surface water currents in the S-111 format. These data are derived from 13 of the latest NOS Operational Oceanographic Forecast Modeling System (OFS) cycles for water bodies and seaports across the country and from the NWS Global Real-Time Ocean Forecast System (Global RTOFS) cycles for the Atlantic and Pacific basins providing broad-scale coverage in the U.S. Exclusive Economic Zone. The data have been parsed into smaller files using tiles based on the electronic navigational chart scheme. The tiles update four times per day providing forecast guidance for 48 to 120 hours. Using the menu on the side, users can navigate to the region they are interested in, see which tiles are available, and then access the data in the cloud where the tiles are stored for download. The visualization is based off of the IHO S-100 portrayal rules which provide an international framework for disseminating marine navigation data. One important component of these rules is they ensure that as additional S-100 data services are added, the various layers are interoperable and that they do not cover up the important navigation information.
While the surface current forecast guidance is currently in prototype status, NOAA anticipates that once operational, these data will be highly valuable for route planning. By understanding where large ocean surface currents are located, ships can ride the currents or avoid them to save on fuel and reduce their carbon emissions which is better for the environment and the bottom line. Other datasets currently under development are water level forecast guidance, weather and wave hazards, and high resolution bathymetry. NOAA will add these additional datasets to the Data Gateway as they become ready.
The beta version of the Data Gateway is one piece of NOAA’s larger effort to integrate marine navigation data services. The Data Gateway provides a visualization of the data NOAA is also serving via the cloud in a machine-to-machine readable format for software companies to utilize in various navigation software applications from portable pilot units to electronic charting systems and even mobile applications.
“We do not anticipate the manufacturers of navigational display systems and underkeel software companies to use the Data Gateway to obtain NOAA’s S-100 datasets everyday, they will use an automated process to make machine-to-machine transfers directly. However, it will provide them with a site to easily see where NOAA S-100 datasets are presently available and find out where NOAA plans to expand the S-100 datasets both in terms of product type and geographic locations.” – John G.W. Kelley
The second visualization resource that NOAA has developed is the PMN Data Dashboard. Through the release of PMN data services, NOAA will improve data services for stakeholders across the nation. To complement this effort, NOAA will also be collecting additional data at strategic ports when resources allow. In February 2020, NOAA completed a socio-economic study to assess the benefits to ports and determine how to prioritize where NOAA focuses resources.

The PMN Data Dashboard visualizes the data used in the socio-economic study along with projects NOAA already has planned and information on the timelines of relevant planned port upgrades.
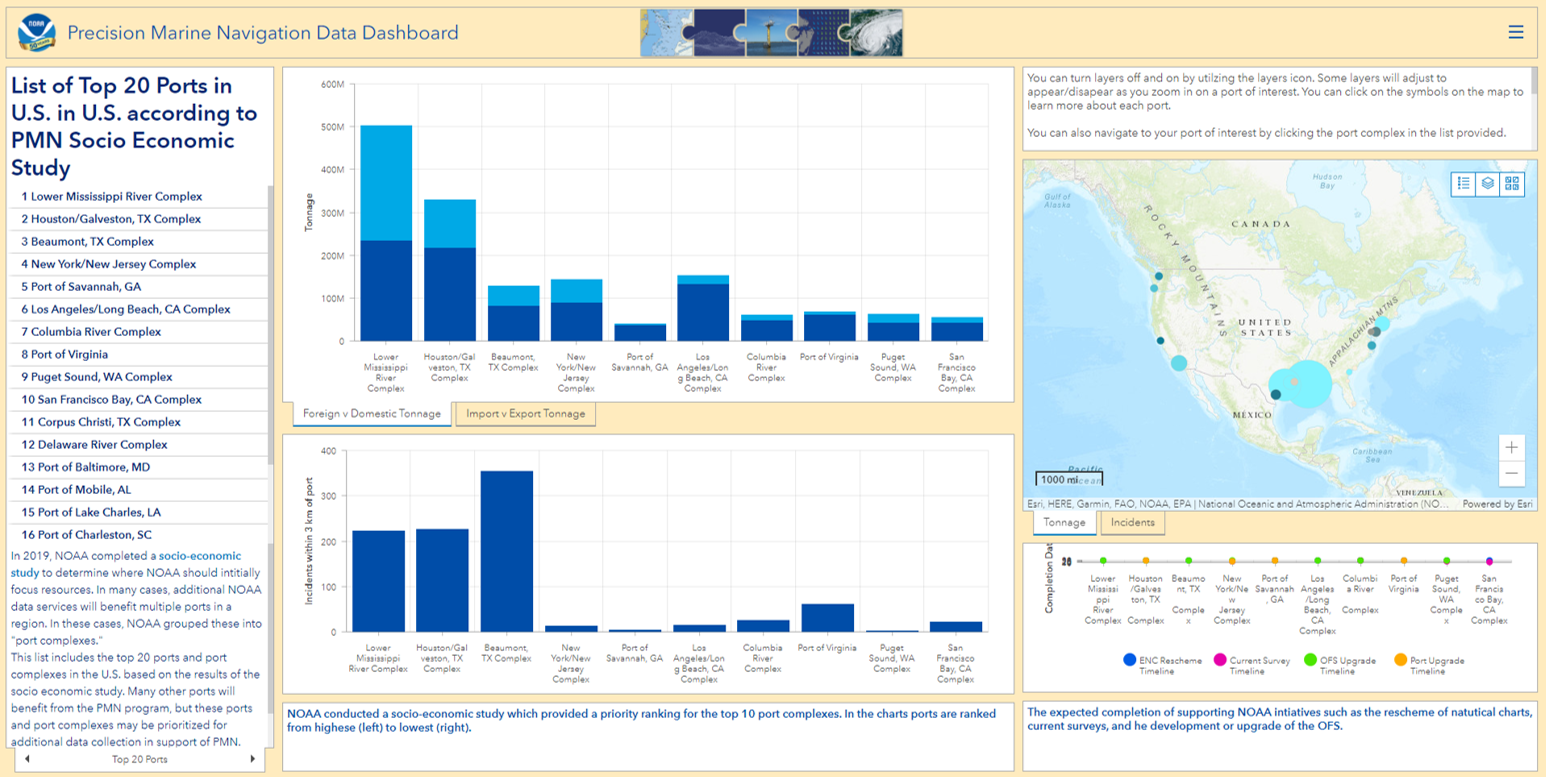
Using this dashboard, NOAA can see how these various priorities line up across the major ports and port complexes compared with NOAA’s current efforts. Over time this Data Dashboard can be updated with additional data sources for example, hydrographic survey plans and the rollout of fog forecasting services.
The PMN Data Gateway and the PMN Data Dashboard demonstrate the ways NOAA is working to expand PMN data services both within ports and throughout the U.S. Exclusive Economic Zone. Both of these resources will be updated as new data services become available.
Please include marine data from Port Royal Sound to include its
Broad and Beaufort Rivers,
and the Chechessee and Colleton Rivers. I am very excited about all the new changes associated with NOAA and can’t wait to learn what y’all have worked on for so long and after living on the rivers 4 the majority of my 68 years!
The submissions are outstanding. Thank you very much for that.