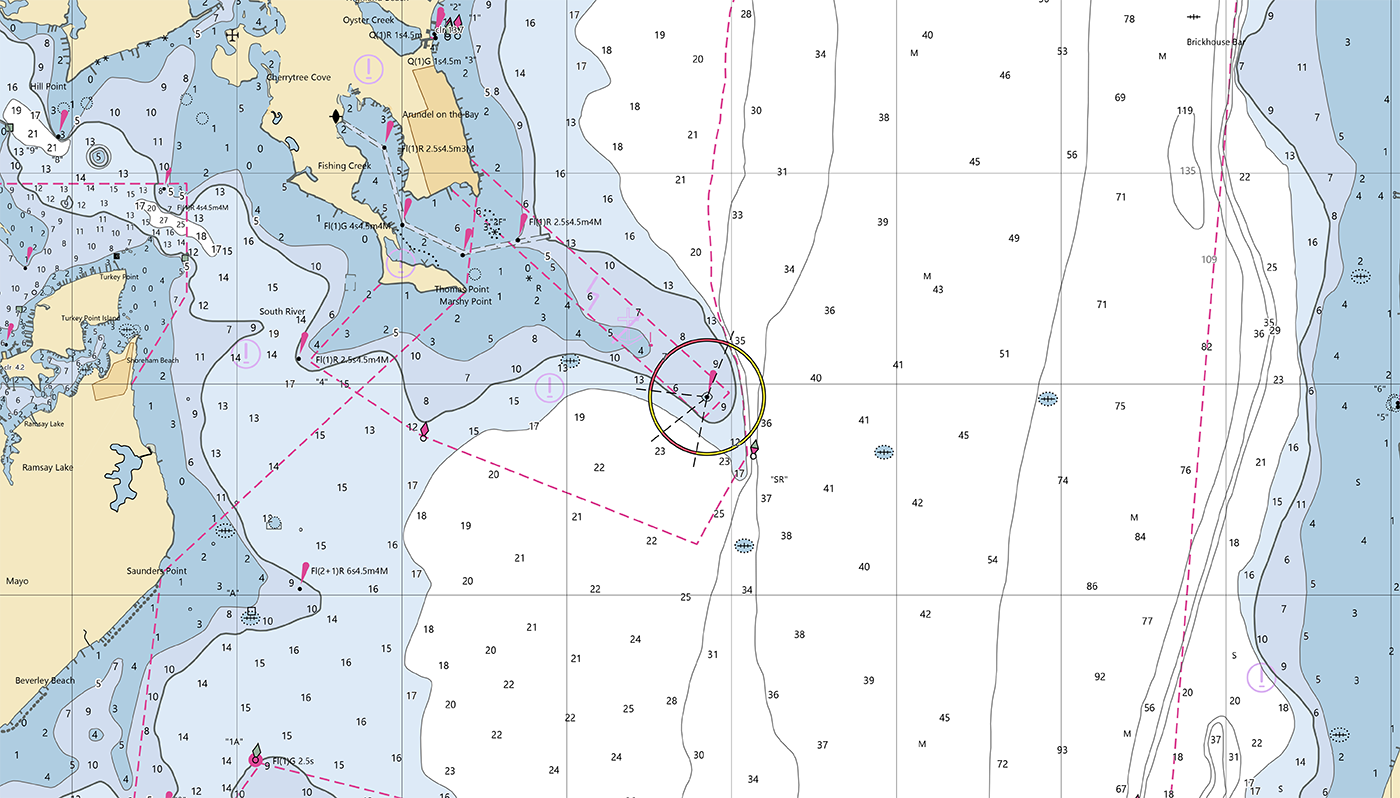
Help keep nautical charts up to date through citizen science

A graphic showing an artistic Citizen Science banner.

NOAA maintains a suite of nearly 2000 electronic navigational charts (NOAA ENC®), as well as the ten volume United States Coast Pilot®. The seafloor and coastline are dynamic environments, which means that our products are constantly scrutinized for possible changes. Each year we make thousands of updates to ENCs, ensuring we are providing the most accurate products possible. The source data for most of these updates comes from NOAA or contractor surveys or from our federal partners, such as the U.S. Army Corps of Engineers and the U.S. Coast Guard. However, we also rely on many other data sources to help keep our ENCs up-to-date.

Continue reading “Help keep nautical charts up to date through citizen science”

Have it your way – creating customized nautical charts using the latest data

An image showing the output of the NOAA Custom Chart application with a chart covering the western side of the Chesapeake Bay.

Nautical charts have always contained a great amount of information – even more so with electronic navigational charts. This information is constantly being updated, necessitating the need to keep your nautical chart suite as current as possible. The Office of Coast Survey’s online NOAA Custom Chart application enables users to create nautical charts directly from the latest official NOAA electronic navigational chart (NOAA ENC®) data. Users now have the ability to create their own nautical charts using individually set parameters, and then save this custom nautical chart as a file that can be viewed or printed.

Continue reading “Have it your way – creating customized nautical charts using the latest data”

The nautical chart update process – build it and we will chart it

Nautical charts are updated with the most current information available through several processes and workflows within NOAA’s Office of Coast Survey. The large majority of these updates consist of revisions to water depth information. The bottom of a water body is changeable by nature, thus hydrographic surveys are constantly necessary to show contemporary depths in a given body of water. What doesn’t happen quite as often are changes to land along the coast, altering the way inlets, harbor entrances, and river mouths appear from a bird’s eye view. Unless there has been a catastrophic event, these changes in land are usually the result of human interaction.

Continue reading “The nautical chart update process – build it and we will chart it”

Backscatter and oil platforms – a Channel Islands adventure

Image showing Channel Islands National Marine Sanctuary, oil platforms, and the sheets covering the project area.
By HAST Bailey Schrader, Operations Officer Lt. Shelley Devereaux and HST Adriana Varchetta

After enjoying the California sunshine in San Francisco Bay, NOAA Ship Fairweather began its transit down the coast towards Santa Barbara, California. The ship would not anchor for the next sixteen days, leaving all crew on 24-hour rotations. Thankfully, the already attenuated crew was visited by augmenting scientists and hydrographers – Physical Scientist Devereaux from the Pacific Hydrographic Branch, HHST Arboleda from NOAA Ship Thomas Jefferson, and HAST Schrader from NOAA Ship Rainier. Together, they traveled south to complete one of the last projects of the season, the area in and around Channel Islands National Marine Sanctuary.

Continue reading “Backscatter and oil platforms – a Channel Islands adventure”

New NOAA website provides marine navigation resources in a central location

Commercial vessels navigating in the Port of Los Angeles-Long Beach

A recently launched website from NOAA’s Precision Marine Navigation (PMN) program will improve the use and accessibility of NOAA’s marine navigation products and services. The website, Marine Navigation, includes links and short descriptions to NOAA’s various navigation resources, providing a one-stop shop that mariners can visit to get the data they need. Designed for shipping professionals and recreational boaters alike, the PMN program hopes the website will become a valuable tool to support all mariners in their navigation planning and decision making processes.

Continue reading “New NOAA website provides marine navigation resources in a central location”

Collecting aerial images on the Chesapeake’s Western Shore

U.S. Naval Academy bridge crossing the Severn River

By Tom Loeper

Early in the morning of June 15, John Doroba and Tom Loeper met with Anne Arundel Park Ranger Adam Smith to collect aerial oblique images of several rivers on the Western Shore of the Chesapeake Bay. These images will be used to update existing content in the United States Coast Pilot 3, Atlantic Coast: Sandy Hook, New Jersey to Cape Henry, Virginia. In addition to acquiring images, experience gained during the field exercise will be used to update aerial photography specifications in the Coast Pilot manual.

Continue reading “Collecting aerial images on the Chesapeake’s Western Shore”

Coast Survey to shut down the Raster Navigational Chart Tile Service and other related services

NOAA will shut down its Raster Navigational Chart (RNC) Tile Service and the online RNC Viewer on October 1, 2021. The NOAA Seamless Raster Navigational Chart Services will be shut down on January 1, 2022. This is part of a larger NOAA program to end production and maintenance of all NOAA traditional paper and raster nautical charts that was announced in the Federal Register in November 2019.

Continue reading “Coast Survey to shut down the Raster Navigational Chart Tile Service and other related services”

By the Numbers: Coast Survey’s 2020 Atlantic Hurricane Season

NOAA Office of Coast Survey 2020 hurricane season infographic

As the 2020 Atlantic hurricane season came to a close on November 30, NOAA’s Office of Coast Survey tallied a few numbers to see what the combined response effort of the navigation response teams, NOAA Ship Thomas Jefferson, and hydrographic survey contractor David Evans & Associates, Inc., looked like.  

Continue reading “By the Numbers: Coast Survey’s 2020 Atlantic Hurricane Season”

NOAA bathymetric data helps scientists more accurately model tsunami risk within Barry Arm

Barry Glacier, Alaska.

In May of 2020, local geologists identified a steep, unstable slope that has the potential to become a tsunami-generating landslide in Barry Arm, a glacial fjord 60 miles east of Anchorage, Alaska. With documented cases of tsunami-generating landslides in Alaska including Lituya Bay in 1958 and Taan Fjord in 2015, this new hazard immediately caught the attention of state and federal partners who quickly joined forces to quantify the risk to those living and boating in Alaska’s Prince William Sound, specifically the communities of Whittier, Valdez, Cordova, Tatitlek, and Chenega.

Continue reading “NOAA bathymetric data helps scientists more accurately model tsunami risk within Barry Arm”