

This week, NOAA’s National Ocean Service is inviting you to explore #Data4Coasts that NOS provides to the public, to researchers and decision makers, and to the many industries involved in coastal resilience and maritime commerce. Much of Coast Survey’s data for the coasts is easily accessible by downloading or by using a web map. Other products, like our beautiful printed nautical charts, are available for purchase – as they have been since the mid-1800s – from chart agents.
We’ve been making charts for a long time – and we’ve never been more excited about it! A quickly evolving (r)evolution is transforming the way we plan voyages and navigate, and Coast Survey is reconstructing our nautical product line for the millions of boaters and commercial pilots who are catching the new digital wave.
Continue reading “Catch the digital wave in NOAA navigation products #Data4Coasts”
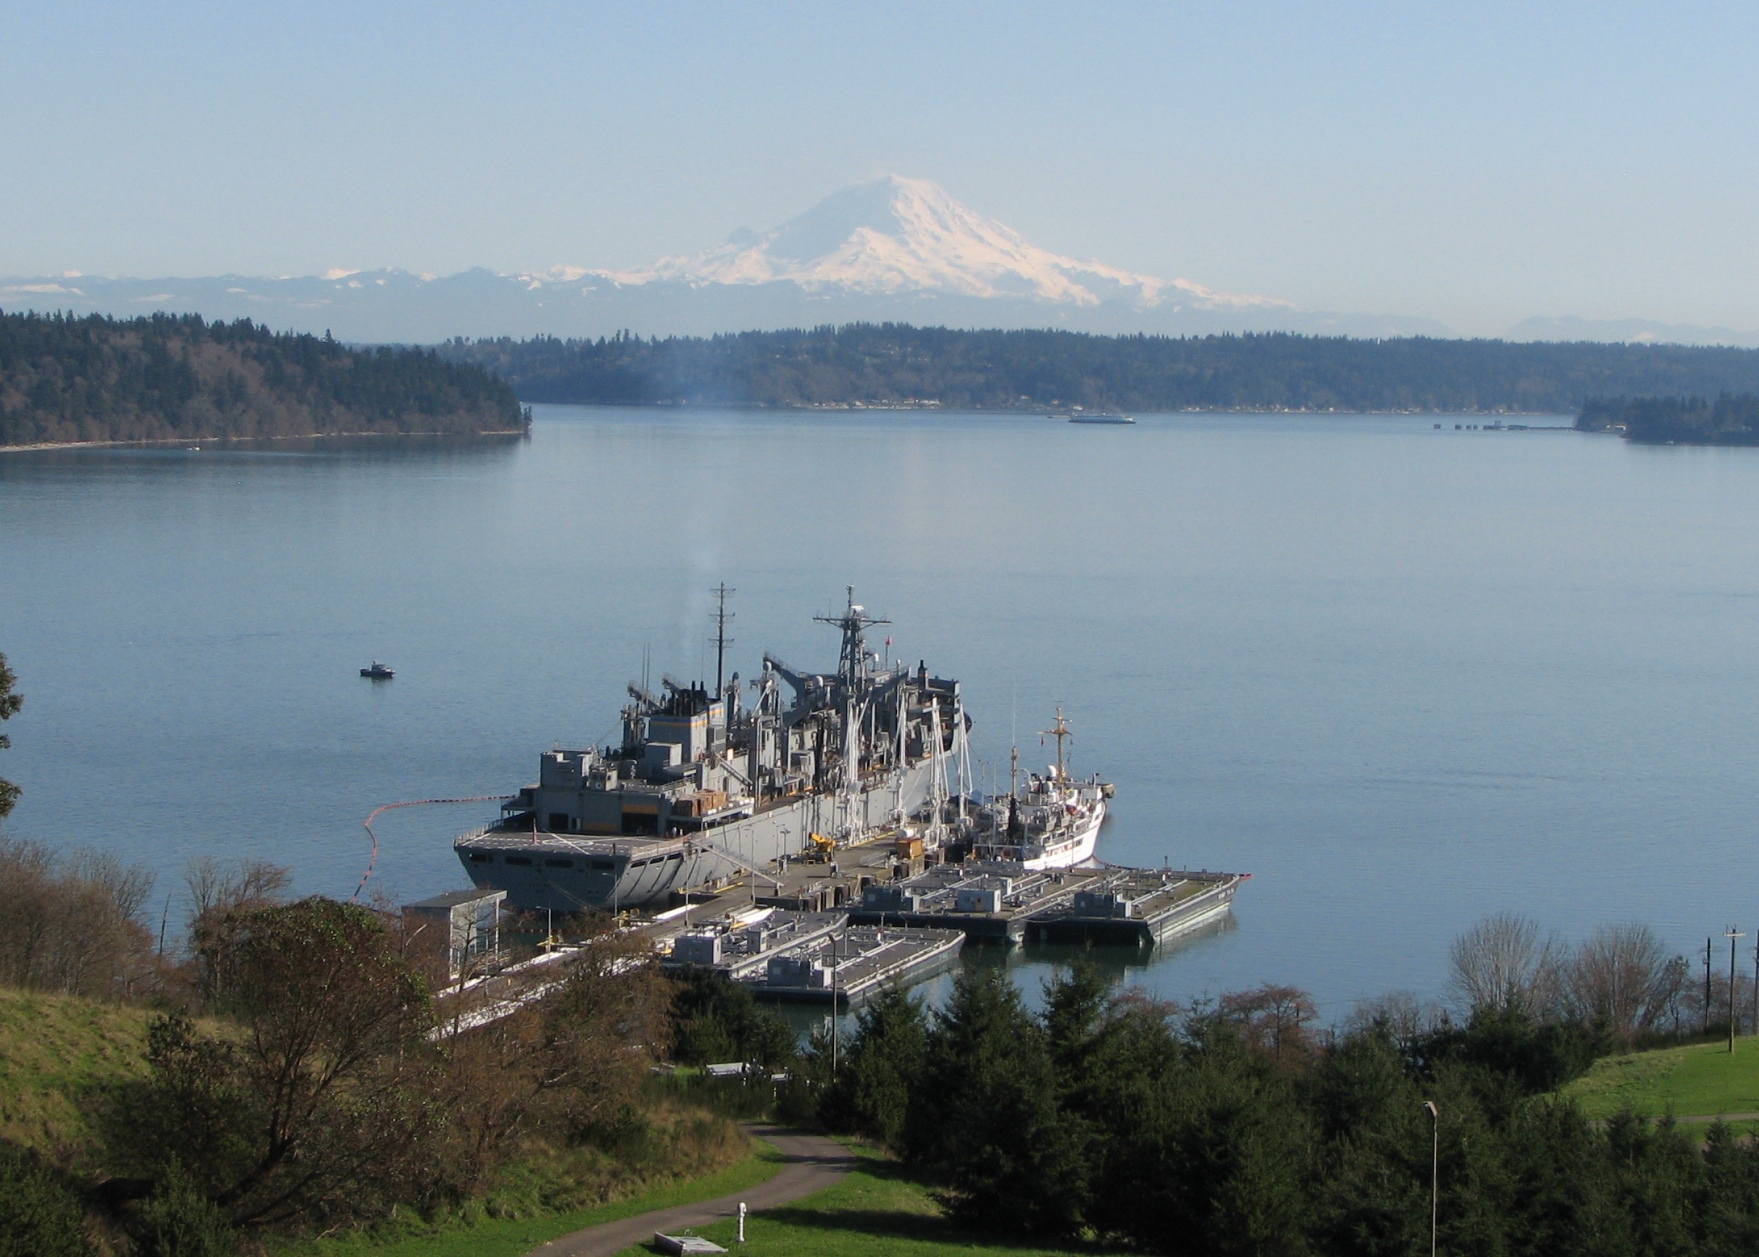
Rainier beauty X 3
NOAA Ship Rainier had the wonderful fortune of cool, clear weather on March 13 as they fueled at the Navy Fuel Depot in Manchester, WA. This provided a clear view of Mount Rainier. However, it is even more rare that you would have three “Rainiers” all in view at once! At the pier you can see USNS RAINIER (on the left side of the pier), NOAA Ship Rainier (on the right side of the pier), and the iconic Mount Rainier in the background. Absolutely beautiful.
Beyond the charts: geological highlights from NOAA’s 2013 hydrographic field season in Alaska
–By Christy Fandel, Coast Survey physical scientist
Have you ever wondered what lies beneath the charted soundings on a nautical chart? While surveying Alaskan waters during the 2013 hydrographic field season, collecting bathymetry to update NOAA’s nautical charts, hydrographers revealed many interesting geologic features on the seafloor.
NOAA focuses a significant portion of our ocean mapping effort along the Alaskan coast. The Alaskan coastline represents over 50% of the United States coastline and dated nautical charts are inadequate for the increasing vessel traffic in this region. NOAA surveys are essential for providing reliable charts to the area’s commercial shippers, passenger vessels, and fishing fleets.
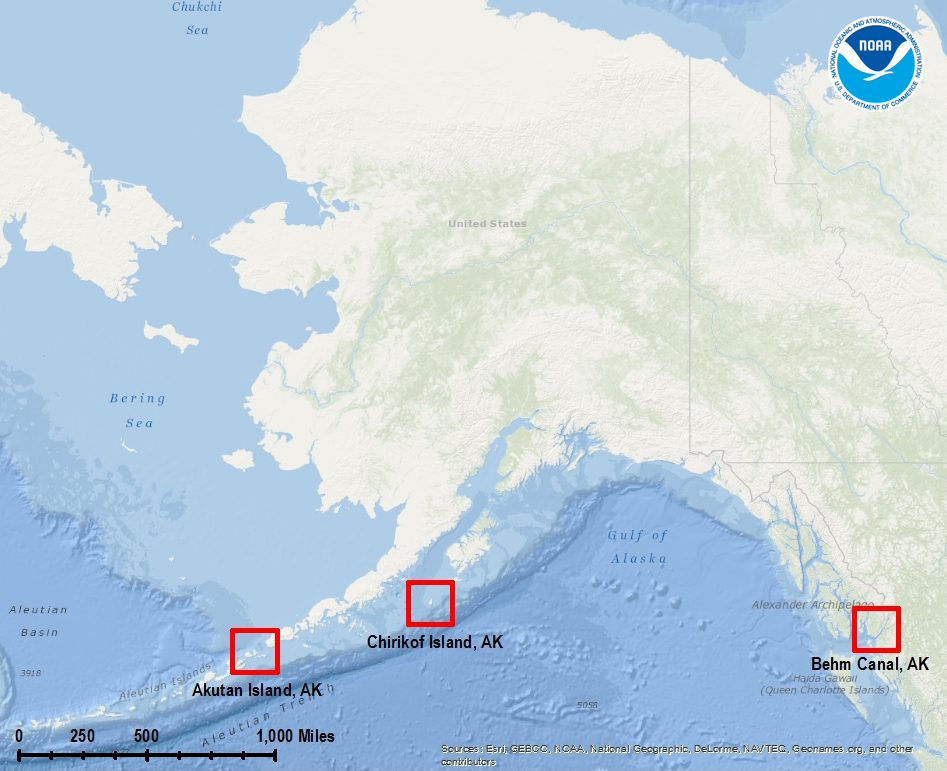
This past season, NOAA-funded hydrographic surveys in Alaska revealed many interesting geological features on the seafloor. Three surveys, in particular, took place in southeastern Alaska in the Behm Canal, along the Aleutian Chain within the coastal waters surrounding Akutan Island, and around Chirikof Island.
Continue reading “Beyond the charts: geological highlights from NOAA’s 2013 hydrographic field season in Alaska”
NOAA navigation response teams improve charts for ships transiting Miami and San Francisco
Coast Survey’s navigation response teams, which are 3-person hydrographic survey teams on small boats, have made a fast start on this year’s survey season.
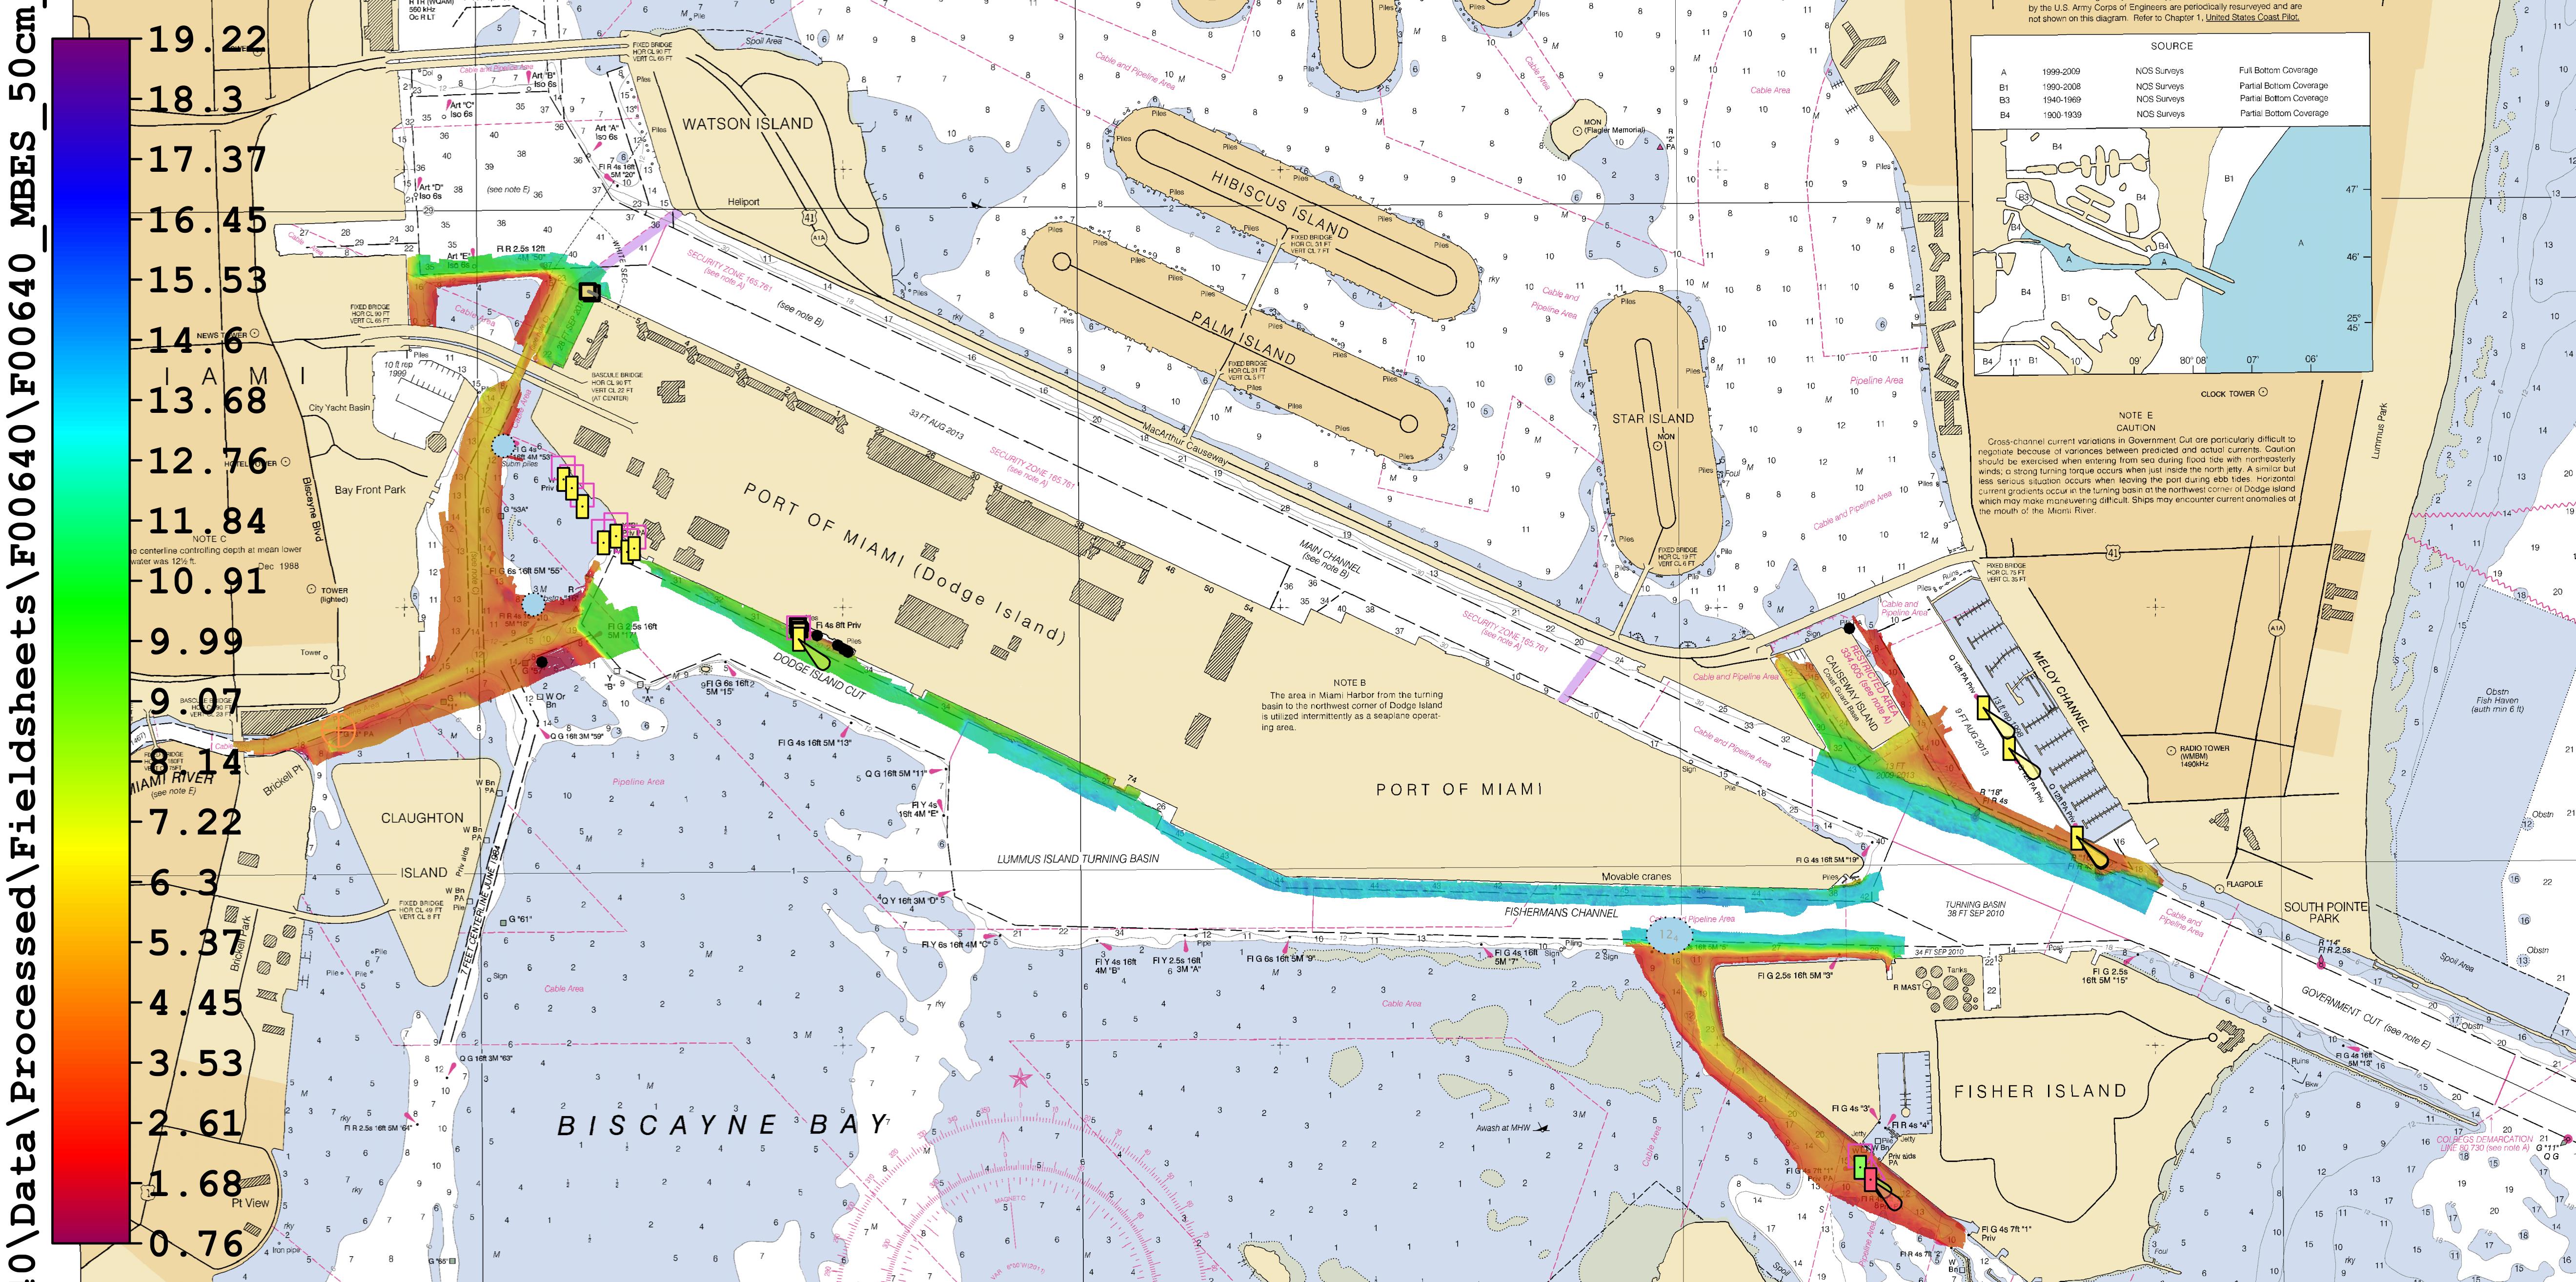
In Florida, where Coast Survey is preparing to issue a “new and improved” Miami Harbor Chart 11468 to alleviate vessel congestion at the Port of Miami, a navigation response team finished final hydrographic surveys to ensure the new chart has the latest and most accurate depth measurements around several areas identified as critical within the port. In just ten days, team members Erik Anderson, James Kirkpatrick, and Kurt Brown acquired, processed, and submitted the multibeam survey data covering 64 nautical miles.
Continue reading “NOAA navigation response teams improve charts for ships transiting Miami and San Francisco”
Call for articles! Hydrography: it’s more than charts
In 2005, the International Hydrographic Organization established World Hydrography Day, celebrated annually on June 21. To observe this year’s World Hydrography Day, NOAA’s Office of Coast Survey is calling for articles for an e-publication dedicated to this year’s theme: “Hydrography: It’s More Than Charts.” Hydrography is the science upon which nautical charting is based, but, as this year’s World Hydrography Day theme conveys, researchers and planners use hydrography in a range of activities that benefit the coastal environment and the marine economy.

Continue reading “Call for articles! Hydrography: it’s more than charts”
NOAA Coast Survey to improve “magenta line” on Intracoastal Waterway nautical charts

The Office of Coast Survey announced today that future editions of nautical charts of the Intracoastal Waterway will be updated to include an improved “magenta line” that has historically aided navigation down the East Coast and around the Gulf Coast. Additionally, Coast Survey will change the magenta line’s function, from the perceived “recommended route” established more than a hundred years ago, to an advisory directional guide that helps prevent boaters from going astray in the maze of channels that comprise the route.
Continue reading “NOAA Coast Survey to improve “magenta line” on Intracoastal Waterway nautical charts”
Great Lakes mariners get new NOAA nautical chart for St. Mary’s River
Vessel operators transiting St. Mary’s River, between Lake Superior and the lower Great Lakes, have a new nautical chart to help lessen the dangers inherent in this narrow and complicated waterway. The first edition of Chart 14887 (St. Marys River – Vicinity of Neebish Island) is available this week as a paper print-on-demand chart, PDF, and raster navigational chart. The electronic navigational chart will be available by March, in time for the beginning of the shipping season. (UPDATE, 2/12/14: NOAA ENC US5MI50 is now available.)
Coast Survey has built the chart from original sources, providing the highest standard of accuracy for hydrographical and topographical features and aids to navigation. The chart provides large-scale (1:15,000) coverage of the up bound and down bound channels of the St. Mary’s River – one of the busiest waterways in the nation. Over 4,100 transits of commercial and government vessels move about 75 million tons of cargo through the 300-day shipping season.
Continue reading “Great Lakes mariners get new NOAA nautical chart for St. Mary’s River”
Happy holidays to chartmakers in the U.S. and around the world

NOAA’s paper nautical charts get a needed update – literally
Paper nautical charts hold a special spot in a sailor’s heart – and in the chart table. The October announcement that the federal government will stop bulk lithographic printing of nautical charts brought some understandable angst to boaters – but fear not! NOAA may be changing the chart production process but we will NOT stop the production of paper charts. We are working with private companies to make them better: printed in brighter colors and available for fast delivery to your door. Most importantly, they are up-to-date to the moment you order it. These improved paper charts are NOAA-certified print-on-demand (POD) nautical charts, created by NOAA Coast Survey cartographers.
While the lithographic paper charts will go away in 2014, anyone can order almost* any printed NOAA chart any time, from the comfort of your home, office, or boat. Just bookmark nauticalcharts.noaa.gov/pod to find the NOAA-certified chart seller who will print your chart “on demand” and ship it to you.
Continue reading “NOAA’s paper nautical charts get a needed update – literally”
NOAA and Coast Guard work together to get more surveying done in the Arctic
By Ashley Chappell, Integrated Ocean and Coastal Mapping coordinator
With 3.4 million square nautical miles of U.S. waters to survey and chart, Coast Survey is up against some big challenges in keeping nautical charts current. A complete survey of those waters would require over 500 ship years and $5 billion ‒ just to acquire the data. It is no wonder that we put substantial effort into a program known as integrated ocean and coastal mapping (IOCM), where trusted partners can provide high quality, standards-compliant hydrographic survey data for a multitude of uses, including chart creation.
One of our biggest challenges is in the Arctic. Whether you knew it or not, the U.S. is an Arctic nation thanks to Alaska, and this formerly frozen region is becoming more accessible to ship traffic as sea ice melts. But much of our Arctic coastal areas have never had full bottom bathymetric surveys, and some haven’t had more than superficial depth measurements since Captain Cook explored the northern regions in the late 1700s.
So NOAA has a dilemma: how do we survey and chart an ice-diminished Arctic when we have limited resources and limited seasonal access? We assessed data age and quality, we reviewed our chart coverage, and we developed the Arctic Nautical Charting Plan for where we would improve chart coverage if we get new data. But our resources for ship and contract surveys can only do so much, and we need more data…

Continue reading “NOAA and Coast Guard work together to get more surveying done in the Arctic”