
NOAA has issued a new nautical chart for the Delong Mountain Terminal, a shallow draft port servicing the Red Dog Mine, on the western coast of Alaska in the Arctic. New chart 16145 fills in historically sparse depth measurements, using new survey data recently acquired specifically for this chart.

Continue reading “NOAA issues new nautical chart for the Arctic”
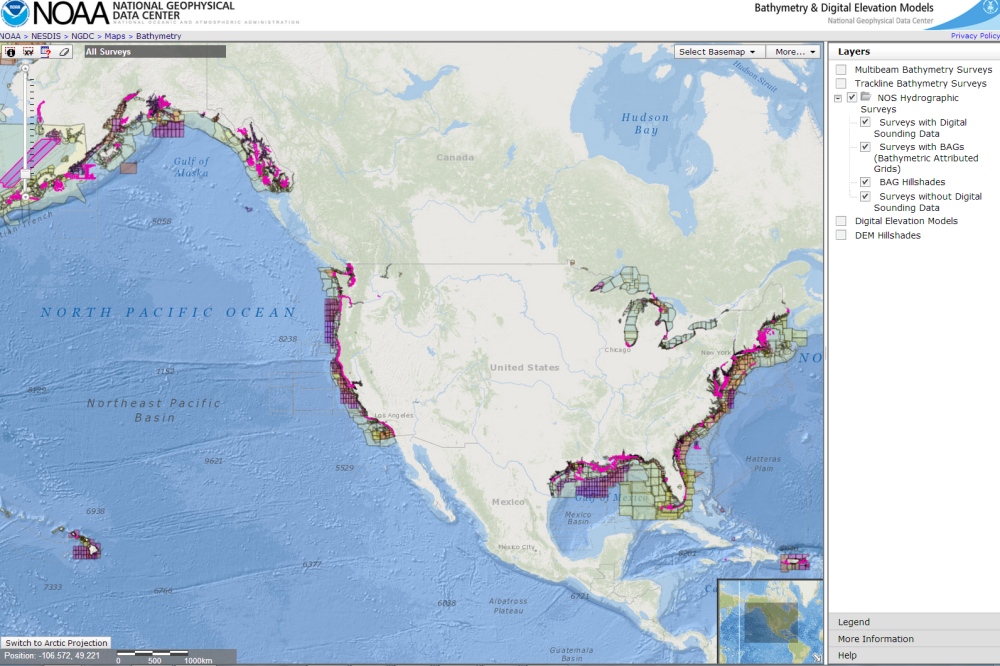
NOAA improves public access to hydrographic survey descriptive reports
by Marcus Cole, Coast Survey’s Cartographic & Geospatial Technology Program
Many are familiar with hydrographic surveys used to update nautical charts.
It isn’t enough, however, to collect just bathymetry during a survey. Without the context, such as when the data was collected, what instrumentation was used, or which tide stations were used to adjust the bathymetry to a particular datum, the data can’t be compiled into a chart update. The data can’t be discovered for a fish habitat study, or an analysis of coastal erosion, or tsunami inundation modeling. And, until two years ago, this metadata (data about data) was collected in a paper document that hadn’t changed much during the last century.
Continue reading “NOAA improves public access to hydrographic survey descriptive reports”
Is your boat is ready: Remember your nautical chart
Ah, the boat is ready, the safety vests are stowed on board, the sky is blue, and the water beckons… But hold on a sec, sailor! Where is your nautical chart?
A terrific t-shirt is sold in tourist shops at some of our nation’s harbors. It has a “definition” of a nautical chart splayed across the front: “chärt, n: a nautical map that shows you what you just hit.” It’s funny… but unfortunately, too true too often.
Resolve to get your nautical chart this year and consult it before you hit something. Advancements in Coast Survey’s digital processes now allow us to review and update charts weekly, and get them to boaters’ fingertips faster − and with less expense − than was possible years ago.
Continue reading “Is your boat is ready: Remember your nautical chart”
NOAA Coast Survey, Coast Guard, and Army Corps of Engineers schedule public “listening sessions”
Over the past few decades, mariners have witnessed the rapid development, reliability, and availability of e-navigation components, such as the global positioning system (GPS) and electronic chart display and information systems (ECDIS). These systems, and other technology, have fundamentally changed mariners’ reliance on traditional navigation services. In addition, the ability to manage data and information provided to the mariner through the automatic identification system (AIS) and cellular service has enhanced the interconnectivity between shore side information providers and shipboard users. These technological advances and data flow will help the mariner receive data, transmit data, and generally improve bridge resource management, situational awareness, and navigational safety.
Continue reading “NOAA Coast Survey, Coast Guard, and Army Corps of Engineers schedule public “listening sessions””
Coast Survey finds historic City of Chester wreck, again
NOAA announced that one of Coast Survey’s navigation response teams found the underwater wreck of the passenger steamer City of Chester, which sank in 1888 in a collision in dense fog near where the Golden Gate Bridge stands today. City of Chester had just left San Francisco and was headed up the California coast to Eureka with 90 passengers on August 22, 1888, when it was struck by the steamer Oceanic. Impaled on Oceanic, which was arriving from Asia, City of Chester remained afloat for six minutes before sinking. Sixteen people died in the accident.
Navigation Response Team 6 (NRT6) found the wreck in May 2013 while they were conducting regular survey duties for safe navigation, assessing a potential pollution threat from the S.S. Fernstream, a wreck from 1952. Sonar images confirmed that the target was the 202-foot steamship City of Chester, sitting upright, shrouded in mud, 216 feet deep at the edge of a small undersea shoal, rising 18 feet from the seabed.

Continue reading “Coast Survey finds historic City of Chester wreck, again”
NOAA hydro field season underway
The 2014 hydrographic survey season is underway, with the NOAA fleet beginning its projects for this year.
Have you ever wondered how Coast Survey goes about determining where to survey and when? Several considerations go into prioritizing survey plans, which are laid out several years in advance. Coast Survey asks specific questions about each potential survey area.
- Is it considered a critical area? If so, how old are the most current survey data?
- Have local pilots or port authorities submitted reports of shoaling, obstructions or other concerns?
- Does the U.S. Coast Guard or other stakeholders from the maritime community (e.g., fisheries, energy, pipelines) need surveys for economic development or ecological protection?
Coast Survey’s 2014 projects reflect these priorities.
Continue reading “NOAA hydro field season underway”
Navigation Response Team 1 finds vehicle during survey of Intracoastal Waterway, assists sheriff’s office
While surveying the approaches to Panama City (FL), St Andrews Bay, and West Bay, Coast Survey’s Navigation Response Team 1 recently made an unexpected find. When team members Mark McMann and Aurel Piantanida reviewed hydrographic data collected with their side scan sonar and multibeam echo sounder, they discovered an upside-down vehicle in Panama City’s West Bay Creek, part of the Intracoastal Waterway (see chart 11385).

Continue reading “Navigation Response Team 1 finds vehicle during survey of Intracoastal Waterway, assists sheriff’s office”
NOAA’s paper nautical charts are here to stay
New certified printing agents bring buying options
It won’t be long before mariners and the boating public will have a wider choice of options and special services when they purchase NOAA paper nautical charts, thanks to NOAA’s expanded “print-on-demand” chart production and distribution system, Coast Survey officials announced on April 4. Coast Survey recently certified new print-on-demand chart printing agents, and gave them the flexibility to offer different color palettes, various papers, a cleaner margin, and a range of services.
Continue reading “NOAA’s paper nautical charts are here to stay”
Coast Survey unveils NOAA ENC Online enhancements
In November 2013, we introduced NOAA ENC Online – a continuous viewer for our electronic navigational charts. You can click on the web map and zoom to selected features or locations, to see the information contained in over a thousand electronic charts of NOAA-charted waters. Each zoom moves you through an ENC depiction that takes into account the ENC scale and other attributes that are encoded in the ENC, allowing features to become visible or invisible as you seamlessly zoom in and out of the data.
Continue reading “Coast Survey unveils NOAA ENC Online enhancements”
Geographic names disappear from charts, but not from history — #Data4Coasts
by Meredith Westington, Coast Survey geographer
Good, informed decisions are often based on analyses of historic and present conditions. Researchers, decision-makers, and amateur history buffs find detailed documentation of past conditions in the thousands of Coast Survey charts, dating back to the mid-1800s, in our Historical Map and Chart Collection.
Just like present day nautical charts, historic charts contain a wealth of information about geographic features — including their names, shape, and condition. Geographic names are important locational references for today’s emergency responders, but current and historic names also convey important aspects of local people and culture, which may persist through time.
Continue reading “Geographic names disappear from charts, but not from history — #Data4Coasts”