
For more than ten years, since NOAA introduced its electronic navigational charts, you have needed to purchase a specialized chart display system to view the NOAA ENC® as a seamless chart database. Starting today, you don’t need a system to view the ENC depictions; you can use Coast Survey’s new web-based viewer called NOAA ENC® Online. (IMMEDIATE CAVEAT: You still need a specialized display system to use the multi-layered functional data that make ENCs so valuable. NOAA ENC downloads are still free to the public.)

Continue reading “Coast Survey unveils NOAA ENC Online Viewer”
Better nautical chart images coming to electronic charting systems
Things are changing for U.S. nautical charts. We think you’re really going to like this improvement!
- Last week, Coast Survey announced that most of our nautical charts are available for free download as PDFs (Adobe Portable Document Format).
- Before that, we announced that the government will stop printing lithographic nautical charts after April 13, but chart users can still get printed charts from a NOAA-certified Print-on-Demand chart provider.
- Today, we have good news for boaters with electronic charting systems that use NOAA raster navigational charts (NOAA RNC®): your charts are going to be easier to read.
Continue reading “Better nautical chart images coming to electronic charting systems”
NOAA nautical charts now available as free PDFs
In case you missed it, yesterday we announced an end to government printing of lithographic nautical charts, effective April 13. Lithographs are part of Coast Survey’s proud heritage, since we started using that printing process for mass-producing charts for the Civil War, and it will be hard to see the era end. (See NOAA announces end of traditional paper chart.) While lithographic printing is scheduled to stop, however, the public will continue to be able to purchase NOAA paper charts as up-to-date print-on-demand products.
As one product ends, another begins. We also announced yesterday that our latest addition to the nautical charting portfolio is the new Portable Document Format (PDF) nautical chart, which provides up-to-date navigation information in this universally available file type. Initially, the PDF nautical charts will be available for a three-month trial, from October 22, 2013, to January 22, 2014.
Continue reading “NOAA nautical charts now available as free PDFs”
NOAA Ship Fairweather surveying ports of Los Angeles and Long Beach for shipping safety
From surveying our most northern Alaskan waters last year, to our southern coastal waters this year, NOAA Ship Fairweather has really been making the hydrographic rounds, so to speak. This month, Fairweather’s hydrographic work is reaping benefits for the maritime industry in Los Angeles and Long Beach.
Fairweather is surveying this area in response to requests from the Port of Los Angeles, the Port of Long Beach, and the pilots who maneuver increasing large oil tankers and cargo ships through the area’s crowded shipping lanes. This project will acquire data for comprehensive updates to NOAA nautical charts 18749 and 18751, which provide the depth measurements and aids to navigation that mariners rely on for safe transit. Fairweather last surveyed the area in 1975, and NOAA contracted for a small survey in 2000.
Continue reading “NOAA Ship Fairweather surveying ports of Los Angeles and Long Beach for shipping safety”
NOAA Ship Rainier + enthusiastic students = future hydrographers?
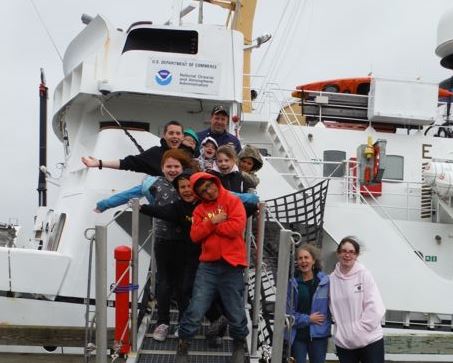
On September 13, NOAA Ship Rainier began surveying Cold Bay, its fourth project of the summer. Cold Bay is a small town on the Aleutian Peninsula approximately 540 miles southwest of Anchorage, Alaska. The town currently has approximately 88 full-time residents and boasts an airport with one of the longest runways in Alaska.
Continue reading “NOAA Ship Rainier + enthusiastic students = future hydrographers?”
Bathymetric AUV shows promise for NOAA surveying
In a step towards greater efficiency in NOAA’s hydrographic surveying, experts onboard the NOAA Ship Ferdinand R. Hassler just wrapped up the first extended testing of Coast Survey’s new bathymetric mapping autonomous underwater vehicle (AUV). From Sept 3 to 13, the vehicle completed ten missions lasting up to 16 hours during day and night, while the ship continued with its assigned hydrographic surveys in the approaches to Portsmouth, New Hampshire.
This AUV is equipped with high resolution seabed mapping equipment similar to the ship’s, including a high accuracy positioning system and multibeam echosounder capable of producing seamless maps of the seafloor.
Continue reading “Bathymetric AUV shows promise for NOAA surveying”
Introducing NOAA’s new ENC Direct to GIS
 Features in an electronic navigational chart represent thousands of pieces of data describing the coastal and marine environment. This data includes coastal topography, bathymetry, landmarks, geographic place names, and marine boundaries for the specific geographic region encompassed by the chart. What if we could aggregate the ENC features into a geospatial database? Such a product would provide a continuous depiction of the U.S coastal and marine environment.
Continue reading “Introducing NOAA’s new ENC Direct to GIS”
NOAA Ship Ferdinand R. Hassler starts new phase of operations
NOAA’s newest survey ship, the Ferdinand R. Hassler, arrived at her new homeport of New Castle, New Hampshire, earlier this month, and began her first New Hampshire survey project today. Hassler was commissioned in Norfolk, Va., in June 2012. She has been undergoing sea trials, training, and certification, and responded to Hampton Roads’ request for rapid survey assistance after Hurricane Sandy last year.

Continue reading “NOAA Ship Ferdinand R. Hassler starts new phase of operations”
On this day in 1943, U.S. Coast and Geodetic Survey Ship HYDROGRAPHER contributes to significant Allied victory
by Lieutenant Matt Forney and Captain Bob Pawlowski (NOAA, ret.)
July 28 marks a little-known but important milestone in our nation’s history.
On August 15, 1943, Allied forces stormed the beaches of Kiska Island, Alaska, in an attack on Japanese occupation. They found an empty island. As it happened, the Japanese Northern Army had secretly evacuated, under a cover of fog, a few weeks earlier, on July 28, thus ending the occupation of the Aleutian Islands.
Today, then, is the 70th anniversary of the last day that foreign forces occupied U.S. soil. And our Coast Survey predecessors were an important player in that event.
The U.S. Coast and Geodetic Survey was one of NOAA’s predecessor agencies. During WWII, the USC&GS sent more than a thousand civilian members and over half of its commissioned officers to the military services. (See the NOAA Central Library account, The World Wars.) Coast Surveyors served as hydrographers, artillery surveyors, cartographers, army engineers, intelligence officers, and geophysicists in all theaters of the war. Civilians, on the homefront, produced over 100 million maps and charts for the Allied forces. Eleven members of the USC&GS gave their lives during WWII.
USC&GS in the Alaska War Zone

During World War II, the Japanese Northern Army occupied Attu Island (landing there unopposed on June 7, 1942) and Kiska Island, (landing on the next day.) The Aleutian Islands were strategic, as it meant that Japan would control the North Pacific Ocean great circle route for supplies, and the U.S. feared the Japanese would turn these locations into airbases for bombing the west coast of the U.S. mainland.
On May 11, 1943, the U.S. 17th Infantry Division made an amphibious assault on the Island of Attu to retake this territory and strategic landhold. Before the Army could carry out an amphibious attack, however, they called on the men of the U.S. Coast and Geodetic Survey to conduct surveys of landings and anchorages.
The U.S. Coast and Geodetic Survey Ship Hydrographer conducted this important preemptive science to ensure the landing vessels avoided shoals and made it safely to shore. (The Hydrographer was originally built in 1930, and sailed as the USS Hydrographer after being transferred to the Navy on April 15, 1942, for the duration of World War II.)

Following the initial assault, the Hydrographer continued surveying in Massacre Bay, Attu, to identify shoals and outline transport anchorages and supply routes.
After 19 days of fighting between the Japanese Northern Army and well-supplied U.S. forces, the Japanese forces realized that all hope of rescue was lost. They made one last banzai-style assault, and hand-to-hand battle ensued. This fighting continued until almost all the Japanese soldiers were killed. After all was said and done, 549 U.S. soldiers died, and more than a thousand were injured. The Japanese lost over 2,850 men. The U.S. only took 29 prisoners alive.
Meanwhile, the USS Hydrographer was also providing transport services to Shemya, Alaska, so the U.S. could establish a bomber airstrip for retaking Kiska.
On August 13, 1943, the Hydrographer surveyed the approaches, anchorages, and landings on Kiska to support an amphibious assault to retake this territory. Two days later, Allied Forces invaded, unaware that the Japanese had completely abandoned the island on July 28, after hearing of the fall of Attu. The invasion force consisted of 34,426 Allied troops, including elements of the 7th Infantry Division, 4th Infantry Regiment, 87th Mountain Infantry Regiment, and 5,300 Canadians (mainly the 13th Canadian Infantry Brigade from the 6th Infantry Division). Support was provided by 168 aircraft and 95 ships – including the Hydrographer.
Even though the Japanese had gone, the reoccupation came with a price. Seventeen Americans and four Canadians died from friendly fire or booby traps, 50 more were wounded from friendly fire or booby traps, and an additional 130 men came down with trench foot.
The Hydrographer has successful career
In May, 1943, the Hydrographer’s commanding officer was awarded the Legion of Merit for surveying and charting the unknown and dangerous waters surrounding Attu Island during the assault and occupation of that island.
Following her successful service in Alaska, ending the last occupation by foreign forces, the Hydrographer surveyed at Guam during amphibious operations, and at many other locations throughout the Pacific Theater of Operations. The commanding officer was awarded the Bronze Star Medal.
After the war, the Hydrographer returned to USC&GS service. She spent most of the remainder of her career surveying the Atlantic and Gulf coasts before being decommissioned in 1967, after 37 years of service to the country.
Boaters! Get free NOAA nautical products for fun and safety…
Coast Survey’s mandate is to provide nautical products that help make maritime transportation safe. As we develop and improve navigational products for commercial mariners, we also look for opportunities to serve the recreational boating community. All of the products listed below are available as free downloads.
BookletCharts™ are nautical charts in booklet form, downloadable for printing from home computers. People like to put each page into a sheet protector, and keep the updated notebooks on their boats.

For the tons (and tons) of useful information that can’t be put on the nautical charts, check out the United States Coast Pilot®, nine volumes of supplemental information important to safe and enjoyable navigation.
Continue reading “Boaters! Get free NOAA nautical products for fun and safety…”