
NOAA Office of Coast Survey has released a new nautical chart for the Arctic, which will help mariners navigate the Bering Strait. Chart 16190 (Bering Strait North) incorporates precise depth measurements acquired recently by NOAA Ship Fairweather hydrographic surveys.
Coast Survey has also released a new edition of Chart 16220 (St Lawrence Island to Bering Strait).
“Our Arctic Nautical Charting Plan identified the need for 14 new charts in the Arctic,” explains Commander Shep Smith, chief of Coast Survey’s Marine Chart Division. “Chart 16190 was high on our list of priorities, since the Bering Strait is the maritime gateway from the Bering Sea in the Pacific Ocean to the Chukchi Sea in the Arctic Ocean.”
Continue reading “NOAA’s new nautical chart improves safety for maritime gateway to the Arctic”
Updated Arctic chart mitigates risk for commercial transportation on the Kuskokwim
By Andrew Kampia, chief of Products Branch A, Marine Chart Division, Office of Coast Survey
When we say that many Arctic charts are lacking information critical to navigation, we’re not overstating the issue. A case in point was the 2005 edition of Chart 16304, depicting the mouth of Kuskokwim River to the City of Bethel, in Alaska. This was a preliminary chart with no hydrography, no depth measurements whatsoever.

Coast Survey just released updated NOAA Chart 16304, which now includes contemporary shoreline and hydrography. (The NOAA ENC® equivalent — US4AK85M — will be available in a month or two.)
Continue reading “Updated Arctic chart mitigates risk for commercial transportation on the Kuskokwim”
Coast Survey publishes new international chart for navigation between Florida and Cuba
As the nation’s nautical chartmaker, Coast Survey produces the country’s traditional paper charts for coastal waters, territorial waters, and the Great Lakes. We maintain the Print-on-Demand charts that you can purchase from OceanGraphix and East View Geospatial. We make the nation’s raster navigational charts (NOAA RNC®) and electronic navigational charts (NOAA ENC®). And the free downloadable BookletCharts. But did you know we produce international charts, too? NOAA has five international charts covering the Northeastern Pacific Ocean and the Bering Sea… and we just published our sixth, for the opposite coast.
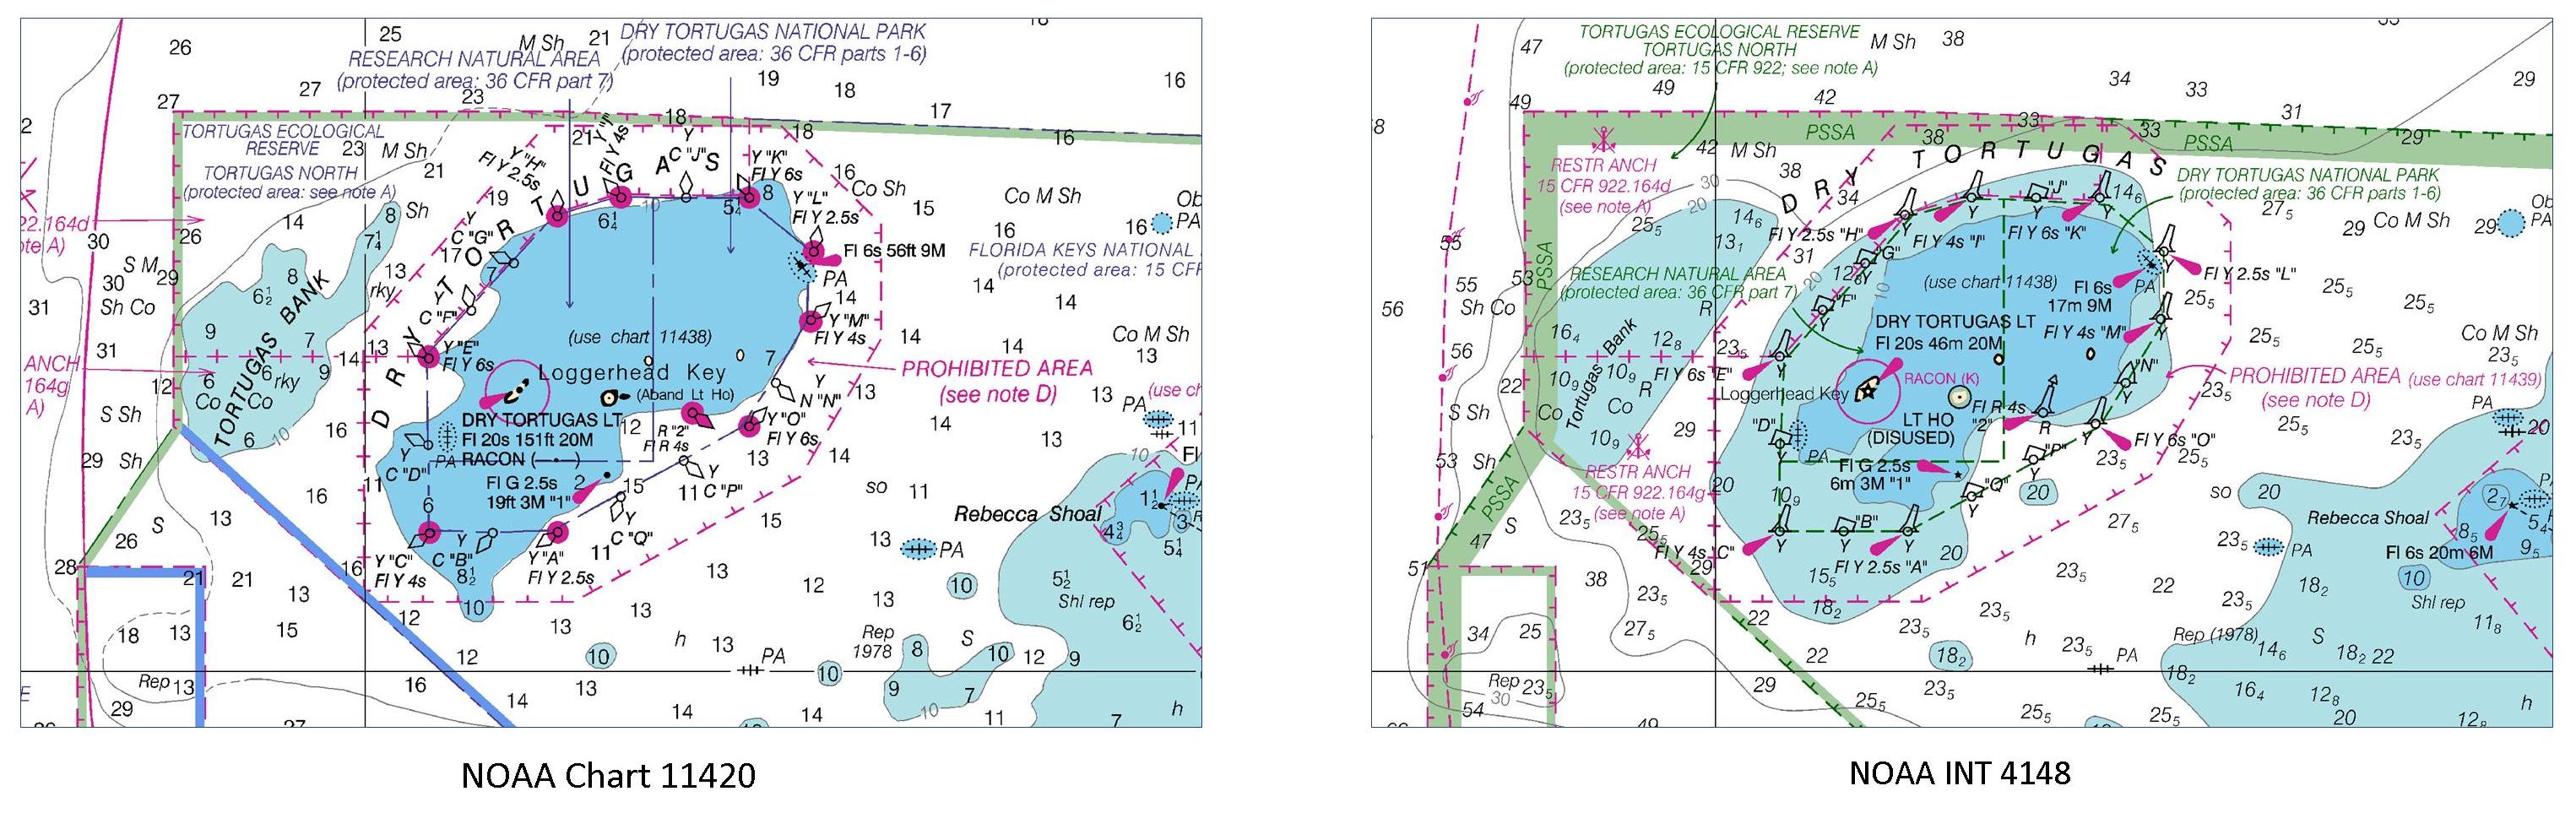
International mariners entering U.S. waters around southwestern Florida now have a new international (INT) nautical chart to help ease their transit. The new chart, INT 4148, has the same information as Chart 11420, Havana to Tampa Bay, but the depictions are converted to the metric system. (Most U.S. charts use either feet or fathoms for depth measurements). INT charts also use some different symbology, so Coast Survey makes those modifications as well.
Continue reading “Coast Survey publishes new international chart for navigation between Florida and Cuba”
Coast Survey issues new Arctic Nautical Charting Plan
In June 2011, Coast Survey issued the first edition of the Arctic Nautical Charting Plan, a major effort to improve Arctic chart coverage that is inadequate for modern needs. After consultations with maritime interests and the public, as well as with other federal, state, and local agencies, we have issued the updated Arctic Nautical Charting Plan: A plan to support sustainable marine transportation in the Alaska and the Arctic.
“Maritime challenges are increasing in the Arctic. As multi-year sea ice continues to disappear at a rapid rate, vessel traffic in the Arctic is on the rise,” said Rear Admiral Gerd Glang, Coast Survey’s director. “This is leading to new maritime concerns, especially in areas increasingly transited by the offshore oil and gas industry and cruise liners.”
Continue reading “Coast Survey issues new Arctic Nautical Charting Plan”
U.S. and Canada eliminate overlapping ENC coverage in the Great Lakes
Countries issue advance notice for changes in electronic charts
To comply with internationally agreed practices, Canada and the U.S. have been eliminating overlapping coverage of electronic navigational charts (ENCs). New changes will soon take effect in the Great Lakes. Under the new ENC coverage scheme, each country is changing their areas of coverage so that only one country’s ENC is available for any given area at a particular scale.
These changes come into effect 0000 Coordinated Universal Time (UTC), on 22 February, 2013.
Continue reading “U.S. and Canada eliminate overlapping ENC coverage in the Great Lakes”
Coast Survey supports inauguration preparations
It was an honor to assist with preparations for the Presidential Inaugural. Our assistance, provided before the event, was a combined effort by one of our navigation response teams, survey technicians, cartographers, and several NOAA officers. Coast Survey’s work was additionally supported by colleagues at NOAA’s Center for Operational Oceanographic Products and Services.

For more about navigational planning for the Potomac River, see Coast Guard to establish security zone for the presidential inauguration.
NOAA Coast Survey discovers special holiday greetings
A Coast Survey hydrographic team recently found a special holiday wish during their survey of the seafloor. We share it with you, along with our sincere hopes for a spectacular 2013!
(To play video, click button in middle of image)
[wpvideo 8ZAIc5dQ]
This video was created by Ian Colvert, a survey technician with Coast Survey’s Navigation Response Team 6.
(Who can guess why he added a “smiley face” at the end of the greeting? Leave your answer in the comments.)
NOAA Coast Survey cartographers update and maintain over a thousand nautical charts
During the first six months of the Coast Survey blog, we have focused largely on the field work – surveying sparsely charted Arctic waters, responding to calls for help following hurricane destruction, finding dangers to navigation, and even identifying historic wrecks. We haven’t covered the day-in, day-out job that is our reason for existence: creating and updating the country’s nautical charts.
Coast Survey has compiled and maintained the nation’s nautical charts for nearly two centuries, after President Thomas Jefferson approved legislation in the Ninth Congress in 1807, and we now maintain a suite of over a thousand charts. We sometimes get the question, “aren’t you done yet?” Haven’t we finished charting all of the U.S. waters?

The simple answer is no: because storms alter seafloors, and water depths constantly change due to shifting shoals, submerged hazards, and coastal development, Coast Survey must continually update the nation’s nautical charts. Charting those changes, and ensuring chart accuracy and precision, is essential to protecting life and property.
The more complicated answer may surprise you. Many of our nation’s marine shipping lanes, harbors, and port areas haven’t been mapped since the 1920s, when measurements weren’t as precise – or even as accurate ‒ as is possible now. Some areas, especially in Alaska, haven’t had bottom measurements since the mid-1770s.
Coast Survey’s Marine Chart Division employs many of the nation’s best cartographers. Since 2009, cartographers have applied approximately 50,000 critical charting corrections to NOAA’s various charting products. In fiscal year 2012 alone, cartographers applied more than 11,000 critical corrections to chart updates.
Over those four years, Coast Survey has also produced over 500 new chart editions (of current charts), and built 200 new NOAA ENC® (NOAA electronic navigational charts). This includes 155 new chart editions and 56 new ENCs in fiscal year 2012.
This year, Coast Survey produced several brand new nautical charts, including a new chart for the Port of San Juan, Puerto Rico, and for the Kotzebue Harbor in Alaska, where increasing ocean commerce required improved navigational products. Coast Survey also released an updated chart of Norfolk Harbor, with a new inset of the Inner Harbor, which has developed as a multi-purpose port area.
In addition to updating old charts, and creating new ones, Coast Survey is making more information accessible from its electronic navigational charts. Effective early 2012, several of NOAA’s ENCs that cover the approaches to the East Coast now alert mariners when they are approaching the right whale seasonal management areas, giving them better information to plan to reduce their speeds or avoid the areas altogether. The seasonal management areas, as encoded into the ENCs, graphically show the areas where vessels greater than 65 feet in length must travel at 10 knots or less to reduce the risk of collisions with right whales. The ENCs will also provide for an alarm on the ship’s electronic chart display and information system as vessels enter the speed zone, further alerting the bridge watchstander of speed restrictions.
We are seeing a gradual shift from paper nautical charts to raster navigational charts and electronic navigational charts. Over the last four years, the public has purchased nearly 428,000 print-on-demand paper charts, and another 392,000 traditional paper charts. Reflecting the booming technology in navigation, the public has downloaded countless millions of the electronic and raster navigational charts that NOAA offers free on the Internet.
Even while cartographers use their expertise to update and innovate, there is still the matter of uncharted U.S. waters – waters that remain to be surveyed. Coast Survey is mandated to provide nautical charts for all U.S. territorial waters and the U.S. Exclusive Economic Zone, a combined area of 3.4 million square nautical miles that extends 200 nautical miles offshore from the nation’s coastline. A complete survey of all of those waters would require 545 ship years and $5 billion just to acquire the data. Lacking those resources, NOAA has instead established priorities for the hydrographic surveys that acquire data necessary for reliable charts. Those priorities are updated annually, and are available on Coast Survey’s website, as NOAA Hydrographic Survey Priorities.
A critical need for new or updated charts is especially emerging in the Arctic, and Coast Survey’s Arctic Nautical Charting Plan addresses the tasks ahead.
Commercial mariners and recreational boaters will always rely on NOAA’s charts to keep them and their passengers and cargo safe from harm. NOAA’s cartographers will always work to earn that trust.
—
Additional resource:
If you note a chart discrepancy, please report it through our online service.
The quiet history of Coast Survey
As NOAA strives to meet the present and future navigational needs of the maritime transportation system, it is sometimes helpful ‒ not to mention inspirational ‒ to look back at history. Coast Survey has an amazing history that isn’t well known. It is a quiet history of men and women who led the country’s mapping and charting advancements in the centuries since Thomas Jefferson authorized the Survey of the Coast in 1807.
Coast Survey maintains a publicly accessible Historical Maps and Charts Collection, with about 35,000 images that anyone can download and print. For history buffs, searching through the images is a great way to find images related to your area of interest. Exploring the charts, one can almost develop personal relationships with the individual Coast Survey assistants and cartographers who produced some truly beautiful work. (Check out the Civil War Special Collection to find some especially intriguing maps, including the pivotal 1861 map showing the density of slave population in the Southern states.) Or you can spend some quality time browsing through little-known sketches and maps in the historical collection maintained by the NOAA Central Library.
Continue reading “The quiet history of Coast Survey”