NOAA releases 2017 hydrographic survey season plans

NOAA’s Office of Coast Survey maintains the nautical charts and publications for U.S. coasts and the Great Lakes. This is over a thousand charts covering 95,000 miles of shoreline and 3.4 million square nautical miles of waters. Measuring depths and determining new dangers to navigation in this large area is a monumental job given the seafloor is constantly changing.
One of NOAA Coast Survey’s biggest tasks during the winter months is to plan hydrographic survey projects for the coming field season. Survey planners consider requests from stakeholders such as marine pilots, local port authorities, the Coast Guard, and the boating community, and also consider other hydrographic priorities in determining where to survey and when. Continue reading “NOAA releases 2017 hydrographic survey season plans”

What does a zip file have to do with historic slave ship AMISTAD?

History is never completely written. There are always new discoveries, new understanding.
NOAA historian John Cloud recently sent Coast Survey an intriguing report:

Yesterday I was looking for some historic Chesapeake Bay T sheets [topography drafts]…  Anyway, down in the bottom of a folder, there was a zipped file, dated 2009, never unzipped. I thought: well, since I have noticed this now, why don’t I unzip it? It turned out to be two overly rescaled jpgs, but using my Keith Bridge tricks [a technique developed by a former Coast Survey historical chart expert] I found the two full-scale originals. It was one chart, with a small part cut off to make two separate files: the original 1838 hydrography for New Haven Harbour!

Continue reading “What does a zip file have to do with historic slave ship AMISTAD?”

NOAA Ship Rainier surveys Uganik Bay

By Ensign Michelle Levano
NOAA Ship Rainier recently arrived in Uganik Bay, off of northwest Kodiak Island, to complete hydrographic survey operations in Uganik Passage and Uganik Bay, including the Northeast Arm, North Arm, and South Arm. Rainier has spent 2013 through 2016 surveying areas around North Kodiak Island, including Kizhuyak Bay, Whale and Afognak Passes, Kupreanof Strait, and Viekoda and Terror Bays. The ship will remain in Uganik Bay until the end of October.

Rainier completed project areas H12916, H12919, and H12848 in the spring. They are now surveying H12693 south through H12849 and H12918.

Continue reading “NOAA Ship Rainier surveys Uganik Bay”

NOAA Ship Fairweather begins multi-mission projects in Alaska

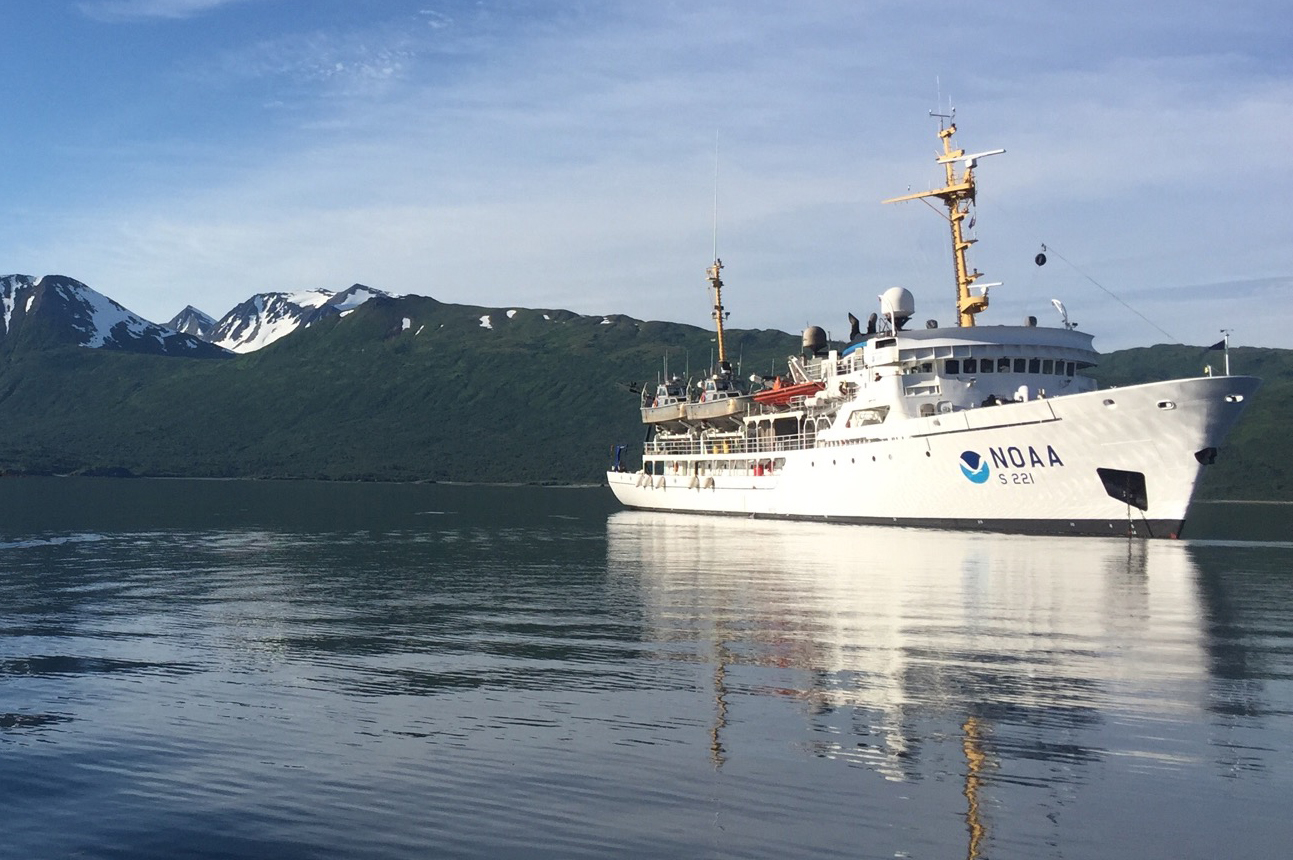
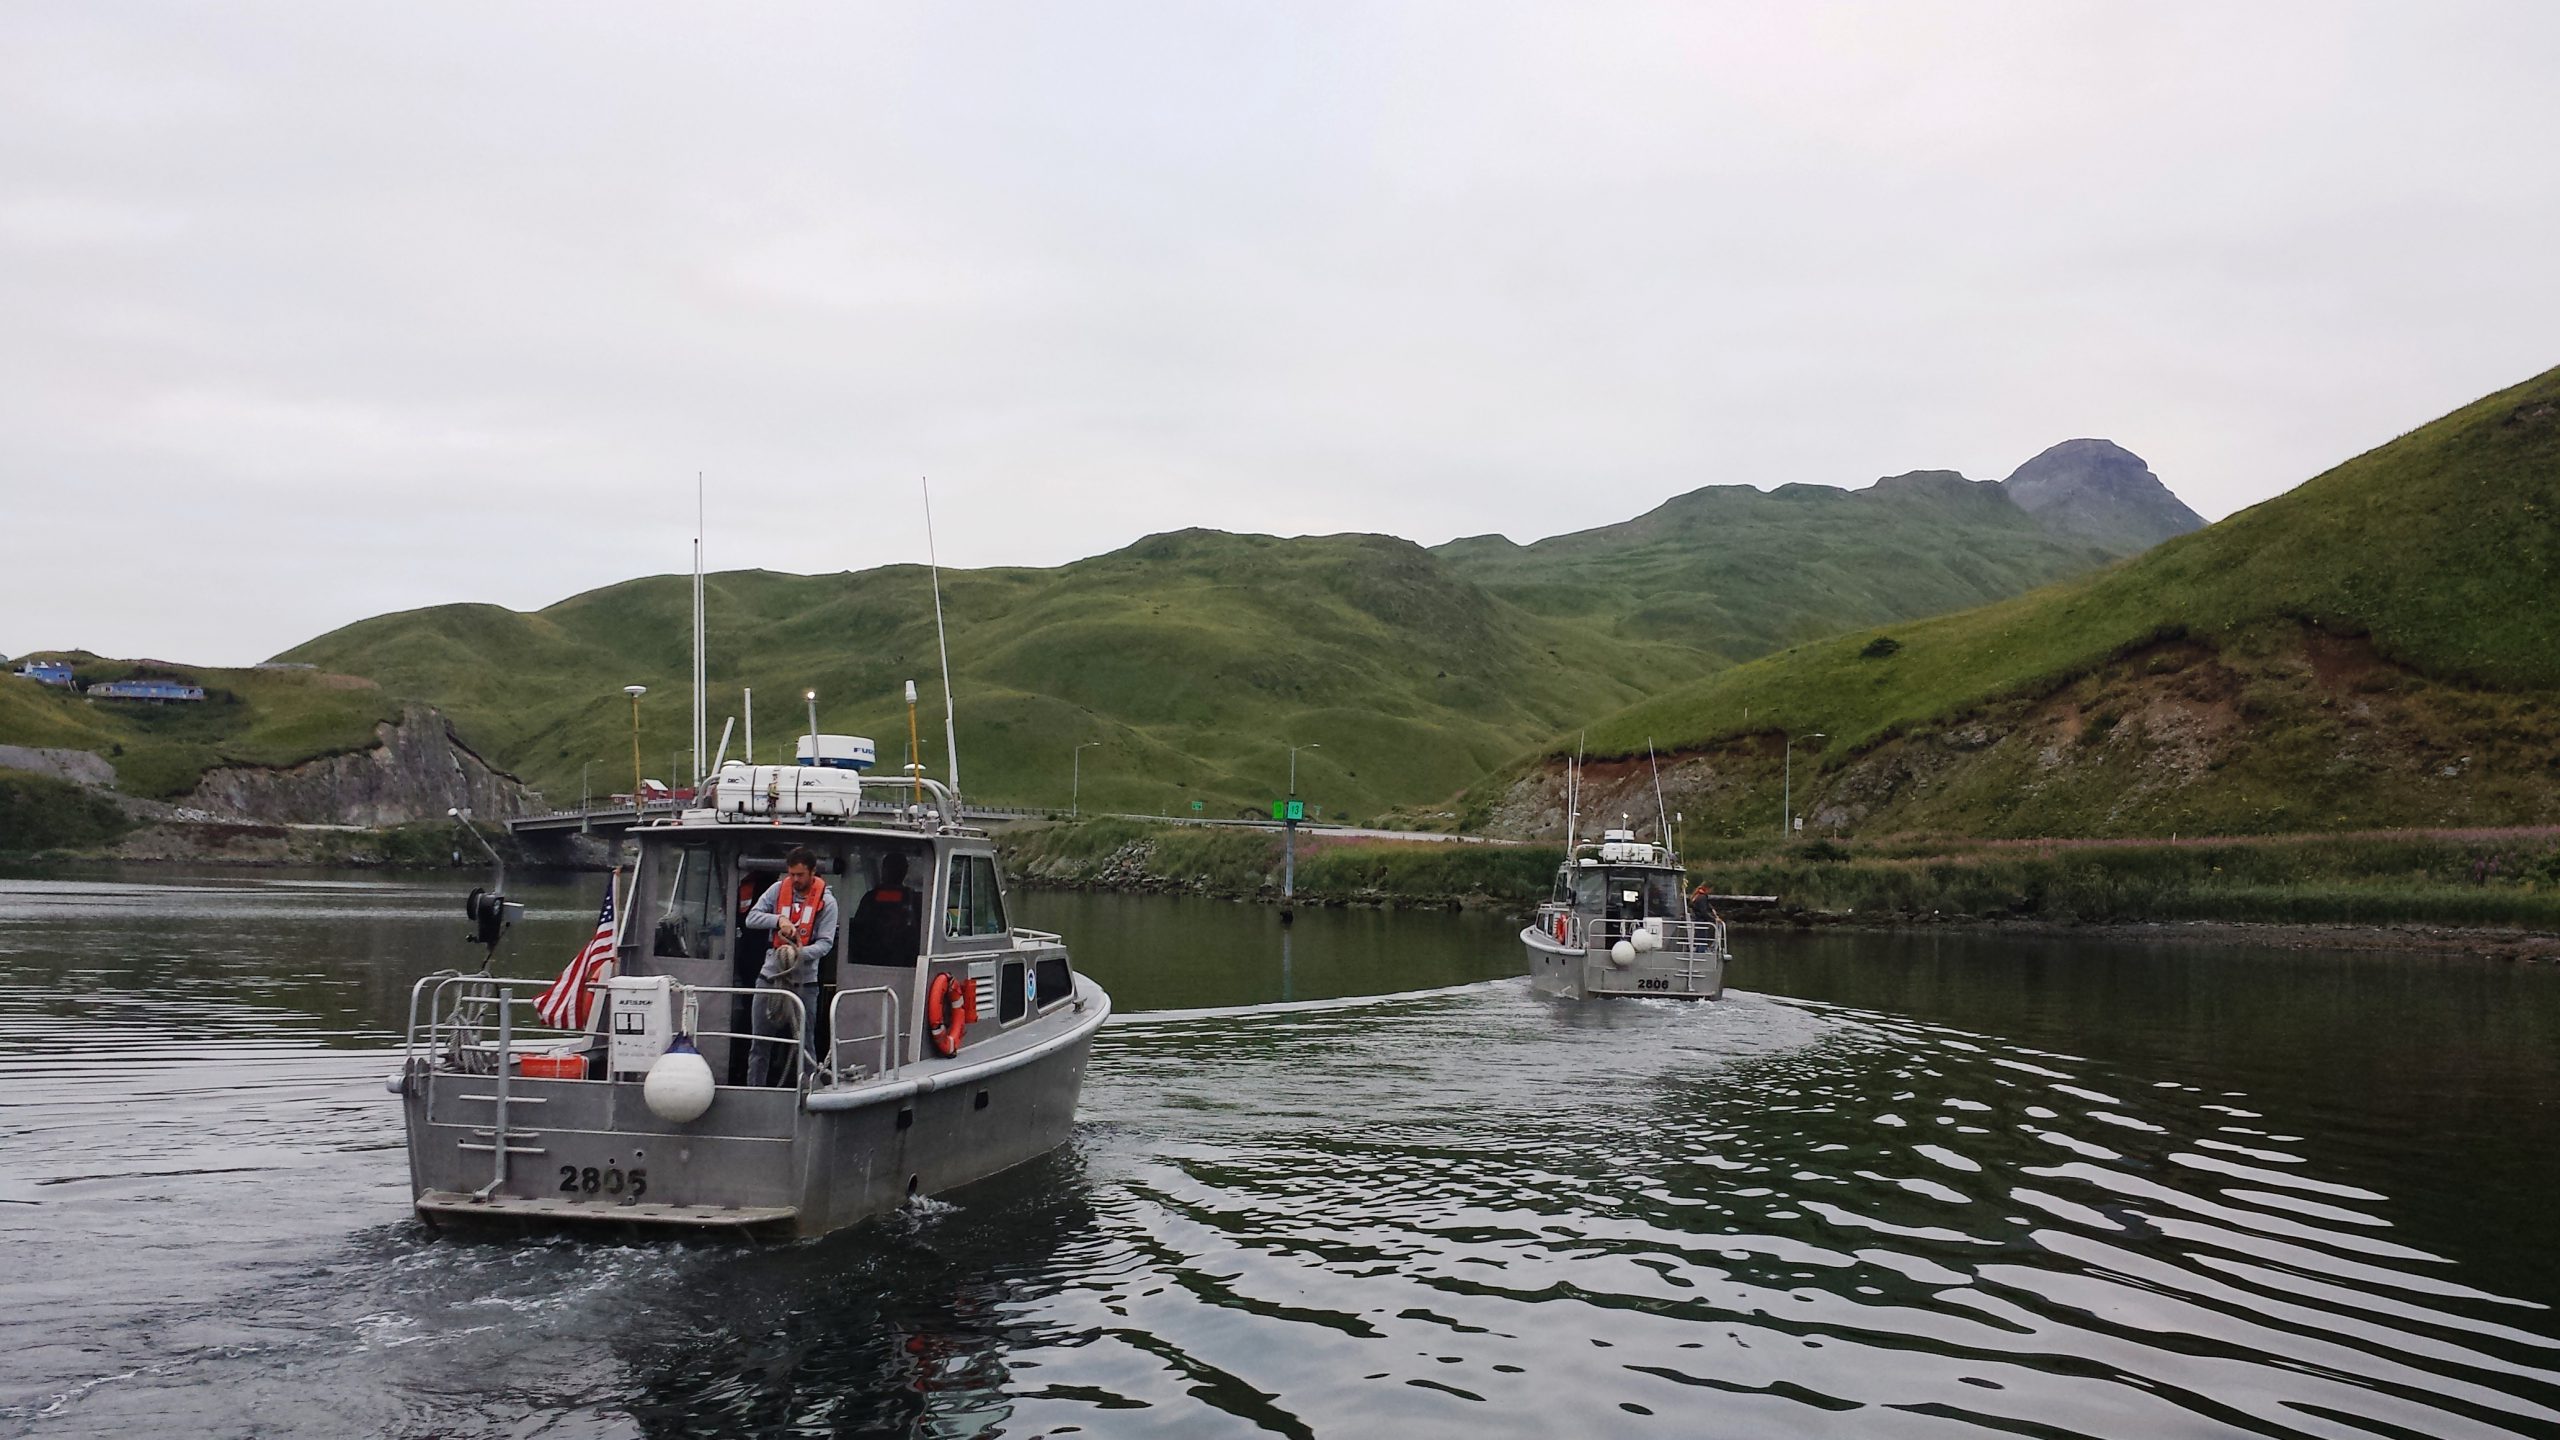
In a unique deployment of resources, last week NOAA Ship Fairweather split its scientific team and vessels to tackle two distinct projects in Alaska. Coast Survey physical scientist Katrina Wyllie and Lt.j.g. Bart Buesseler report on the multi-mission projects.
***
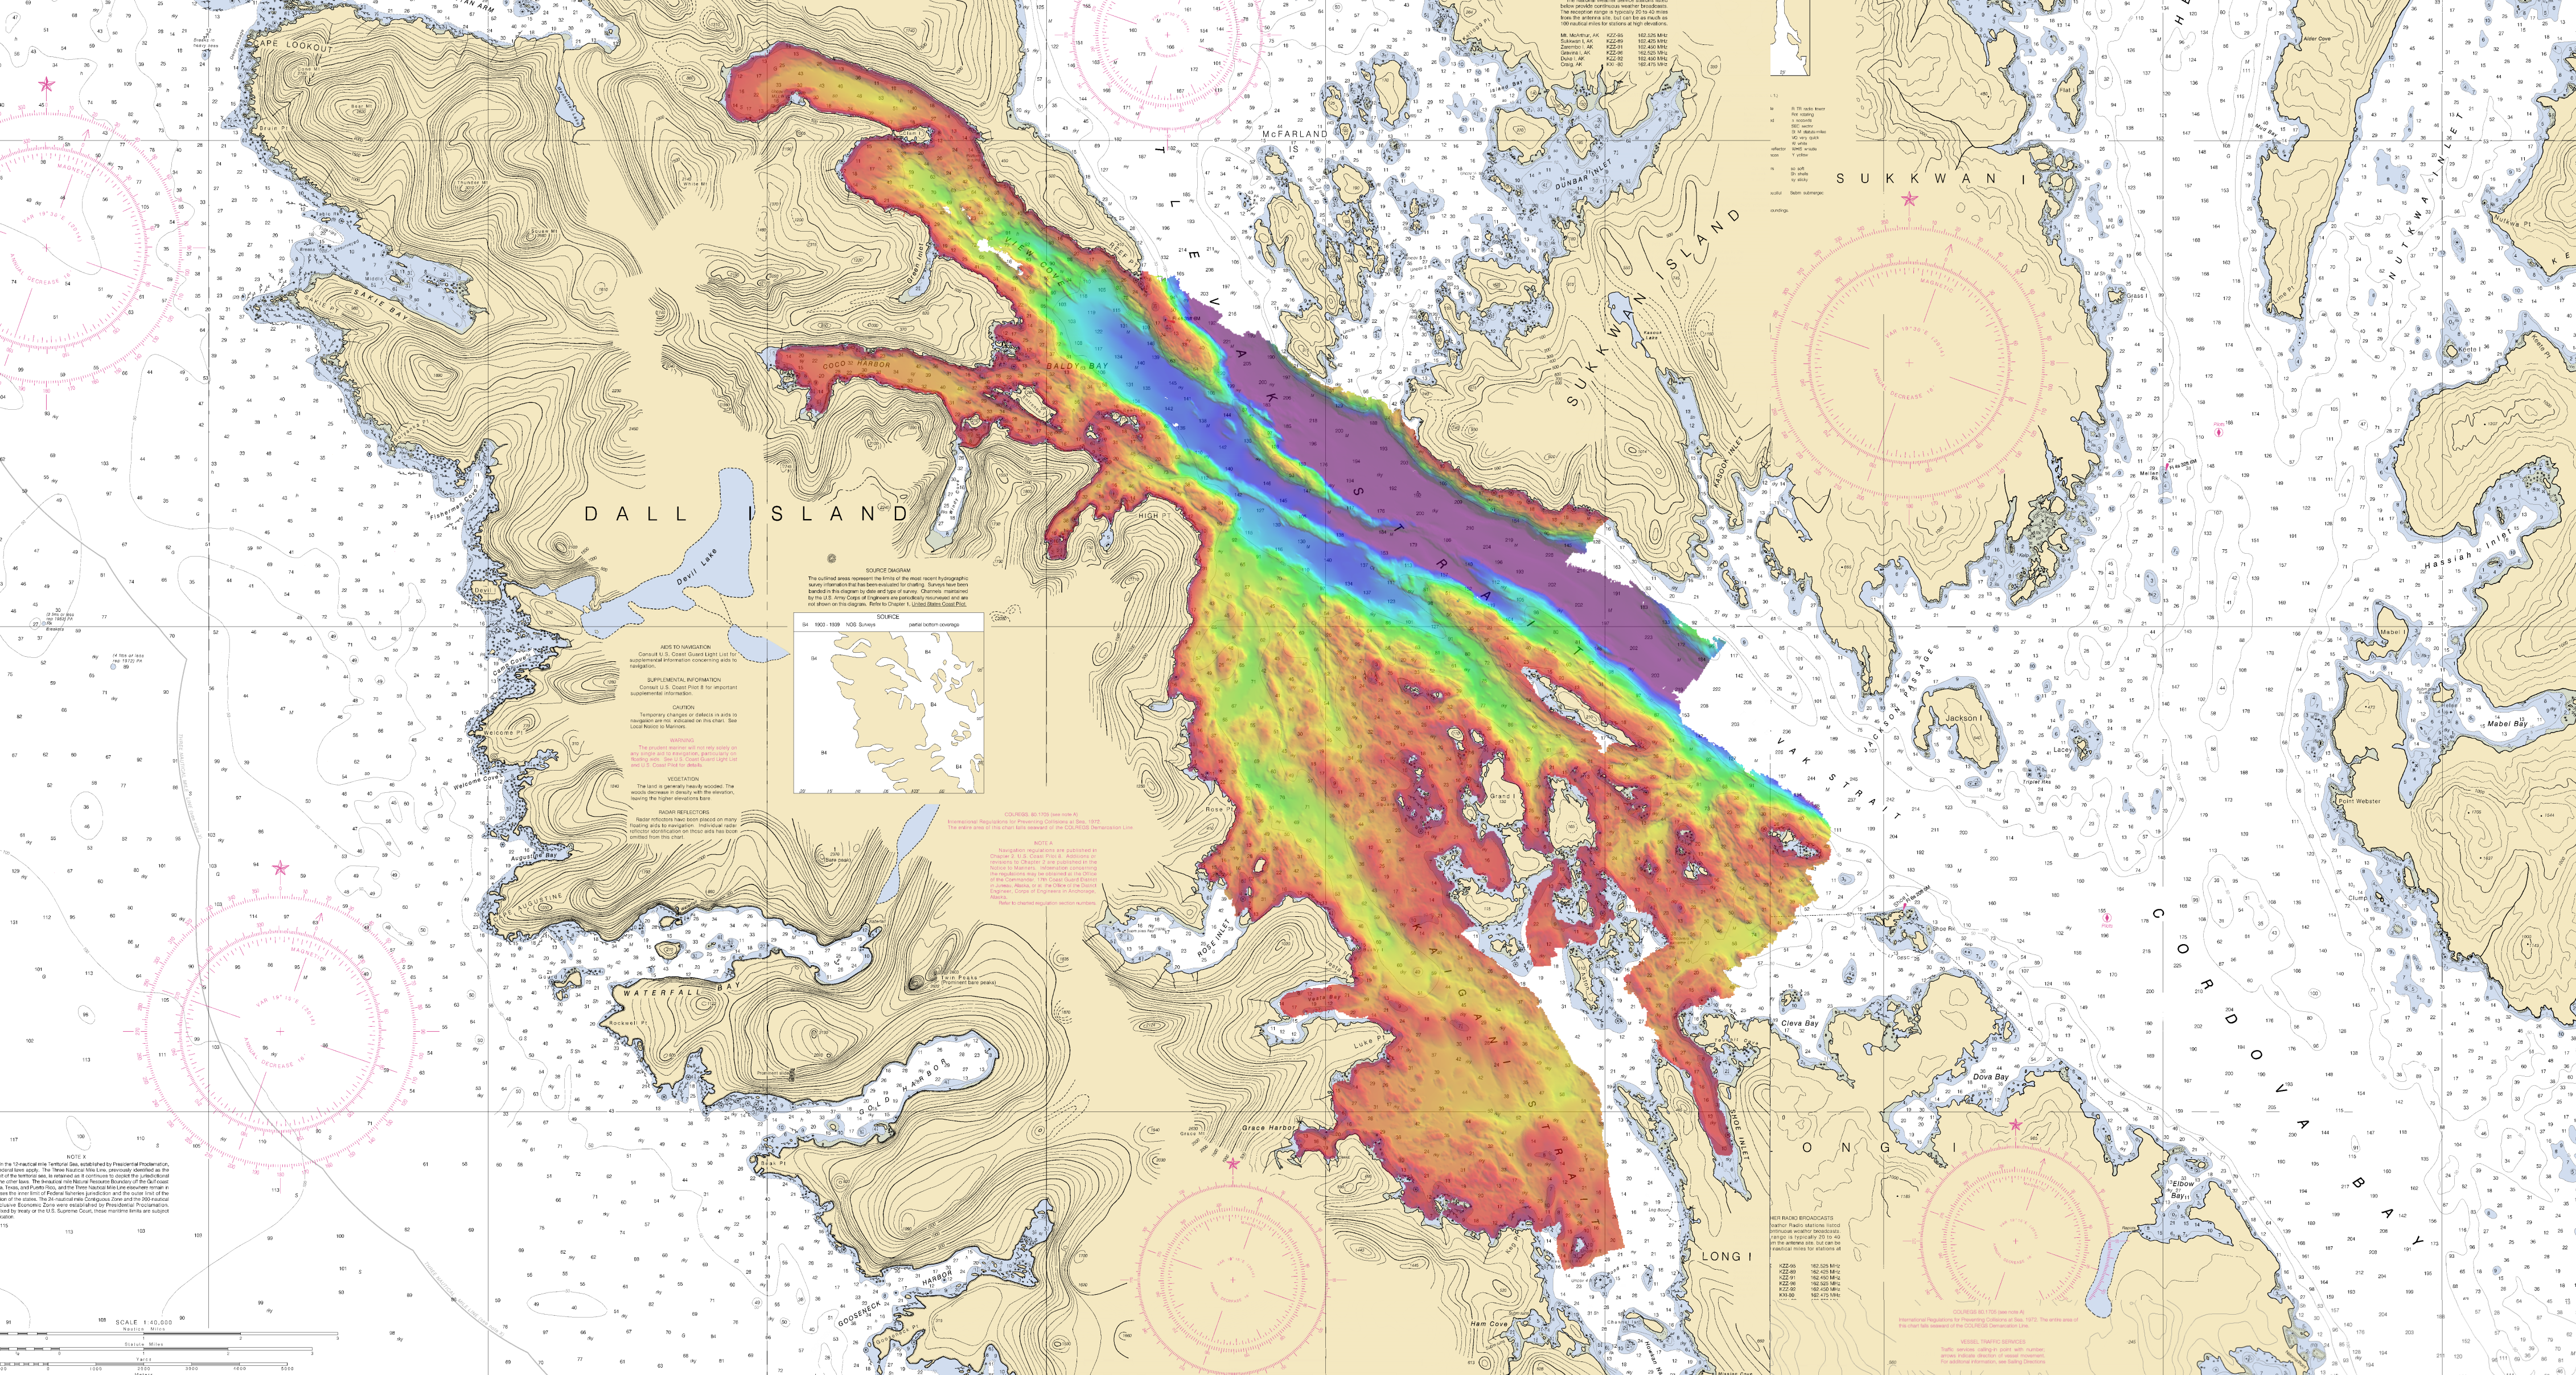
On August 9, NOAA Ship Fairweather departed Dutch Harbor, Alaska, for a FISHPAC project, led by Dr. Bob McConnaughey from NOAA’s Alaska Fisheries Science Center. This project’s primary mission is to statistically associate acoustic backscatter returns with the abundances of fish and crabs that frequent the Bering Sea seafloor. The science team accomplishes this with acoustic data from multibeam, single beam, and side scan sonars. Understanding the value of acoustic backscatter as a habitat-defining character will help scientists understand where fish live and the importance of different habitats. The acoustic data will also be used to correct for differences in the performance of research bottom trawls on different seafloor types, so that stock assessments and fishery management can be improved. To make sure the scientists understand what the acoustic data are showing, each day the ship will stop and collect physical bottom samples of the seafloor to see, touch, and interpret their findings. Further increasing the effectiveness of this mission, all of the multibeam bathymetry data acquired will directly support NOAA’s Office of Coast Survey as the data will be used to update soundings on the nautical charts for the eastern Bering Sea where the ship will be operating.
Continue reading “NOAA Ship Fairweather begins multi-mission projects in Alaska”

Four Gulf of Mexico basins named for officers who led EEZ bathymetric mapping

The U.S. Board on Geographic Names recently named four previously unknown basins in the United States Exclusive Economic Zone (EEZ) in the Gulf of Mexico, honoring retired NOAA officers who mapped the area in the late 1980s and early 1990s. The names — Armstrong Basin, Floyd Basin, Matsushige Basin and Theberge Basin — were proposed by Texas A&M University, based on their new compilation of bathymetry drawn largely from the NOAA multibeam mapping project conducted by now-decommissioned NOAA ships Whiting and Mt. Mitchell.

Newly named Armstrong Basin
A basin in the Gulf of Mexico was named after retired NOAA Captain Andrew Armstrong.

Retired NOAA Capt. Richard P. Floyd was the commanding officer of NOAA Ship Whiting from February 1990 to March 1992; he was followed by retired Capt. Andrew A. Armstrong III, who was CO from February 1992 to January 1994. Retired NOAA Capt. Roy K. Matsushige was commanding officer of NOAA Ship Mt. Mitchell from December 1988 to January 1991, followed by retired Capt. Albert E. Theberge, who served as CO from January to November 1991. The officers led the bathymetric mapping operations under the direction of NOAA’s Office of Charting and Geodetic Services, a predecessor of today’s Office of Coast Survey.
Continue reading “Four Gulf of Mexico basins named for officers who led EEZ bathymetric mapping”

NOAA begins 2016 hydrographic survey season

New data will update nautical charts around the country

As sure as spring arrives, NOAA vessels and independent contractors are hitting the seas for the nation’s 182nd hydrographic surveying season, collecting data for over two thousand square nautical miles in high-traffic U.S. coastal waters.

NOAA Ship Ferdinand Hassler heads out to survey.

“Nautical charts are the foundation for the nation’s maritime economy, and NOAA hydrographers spend months at sea, surveying critical areas to ensure safe navigation for the shipping, fishing, and boating communities,” said Rear Admiral Gerd Glang, director of the Office of Coast Survey.
“Spring is the traditional beginning of the survey season,” Glang explained. “After a winter of data processing, ship maintenance, and personnel refresher training, the NOAA survey ships and Coast Survey navigation response teams are anxious to get to their survey assignments.”
Continue reading “NOAA begins 2016 hydrographic survey season”

Coast Survey announces surveys by navigation response teams

NRT data will be used to update nautical charts

Coast Survey’s navigation response teams have proven their value, time and again, especially after hurricanes when ports suspend operations, and shipping (or naval movements) cease until Coast Survey’s small boats can locate underwater dangers to navigation. But what do the six navigation response teams (NRTs) do during those long periods between deployments for maritime emergencies? They are busy, mostly year-round, collecting hydrographic data for updating nautical charts.
Continue reading “Coast Survey announces surveys by navigation response teams”

Studying the use of satellite-derived bathymetry as a new survey tool

by Ensign Kaitlyn Seberger, onboard NOAA Ship Thomas Jefferson

Nautical charts are an important tool in navigating safely in coastal waters, and Coast Survey’s mission is to keep these charts up to date. However, maintaining accurate charts can be a challenge in locations where sandy shoals may shift seasonally and present a danger to navigation. These areas differ from the current nautical charts, and bottom contours change so rapidly that it may seem an impossible task to keep up using the traditional survey methods. Office of Coast Survey and NOAA Ship Thomas Jefferson are seeking a solution to this ongoing problem and may have an answer with satellite-derived bathymetry.
Satellite-derived bathymetry (SDB) begins with using multi-spectral satellite imagery, obtained by satellites such as Landsat and WorldView2, which compares green and blue color bands.
Continue reading “Studying the use of satellite-derived bathymetry as a new survey tool”

Report from the Arctic: Surveying Kotzebue Sound 2015

By Starla Robinson, project manager in Coast Survey’s Hydrographic Surveys Division
Two hundred years after Otto von Kotzebue and the crew of the Ruiric explored what would later be named Kotzebue Sound, NOAA ships Fairweather and Rainer follow in the same tradition. Two centuries ago they were searching for the Northwest Passage in support of trade. Today, we explore to improve the science and safety of navigation in support of commerce, environmental protection, and local communities. Our bathymetric data and observations will also be used to better inform coastal decision-making.

kotzebue-historical charts
Original chart of Kotzebue Sound (left). 1973 chart of Kotzebue Sound (right). Today’s chart of the project area is not significantly different from that of 1973.

Continue reading “Report from the Arctic: Surveying Kotzebue Sound 2015”