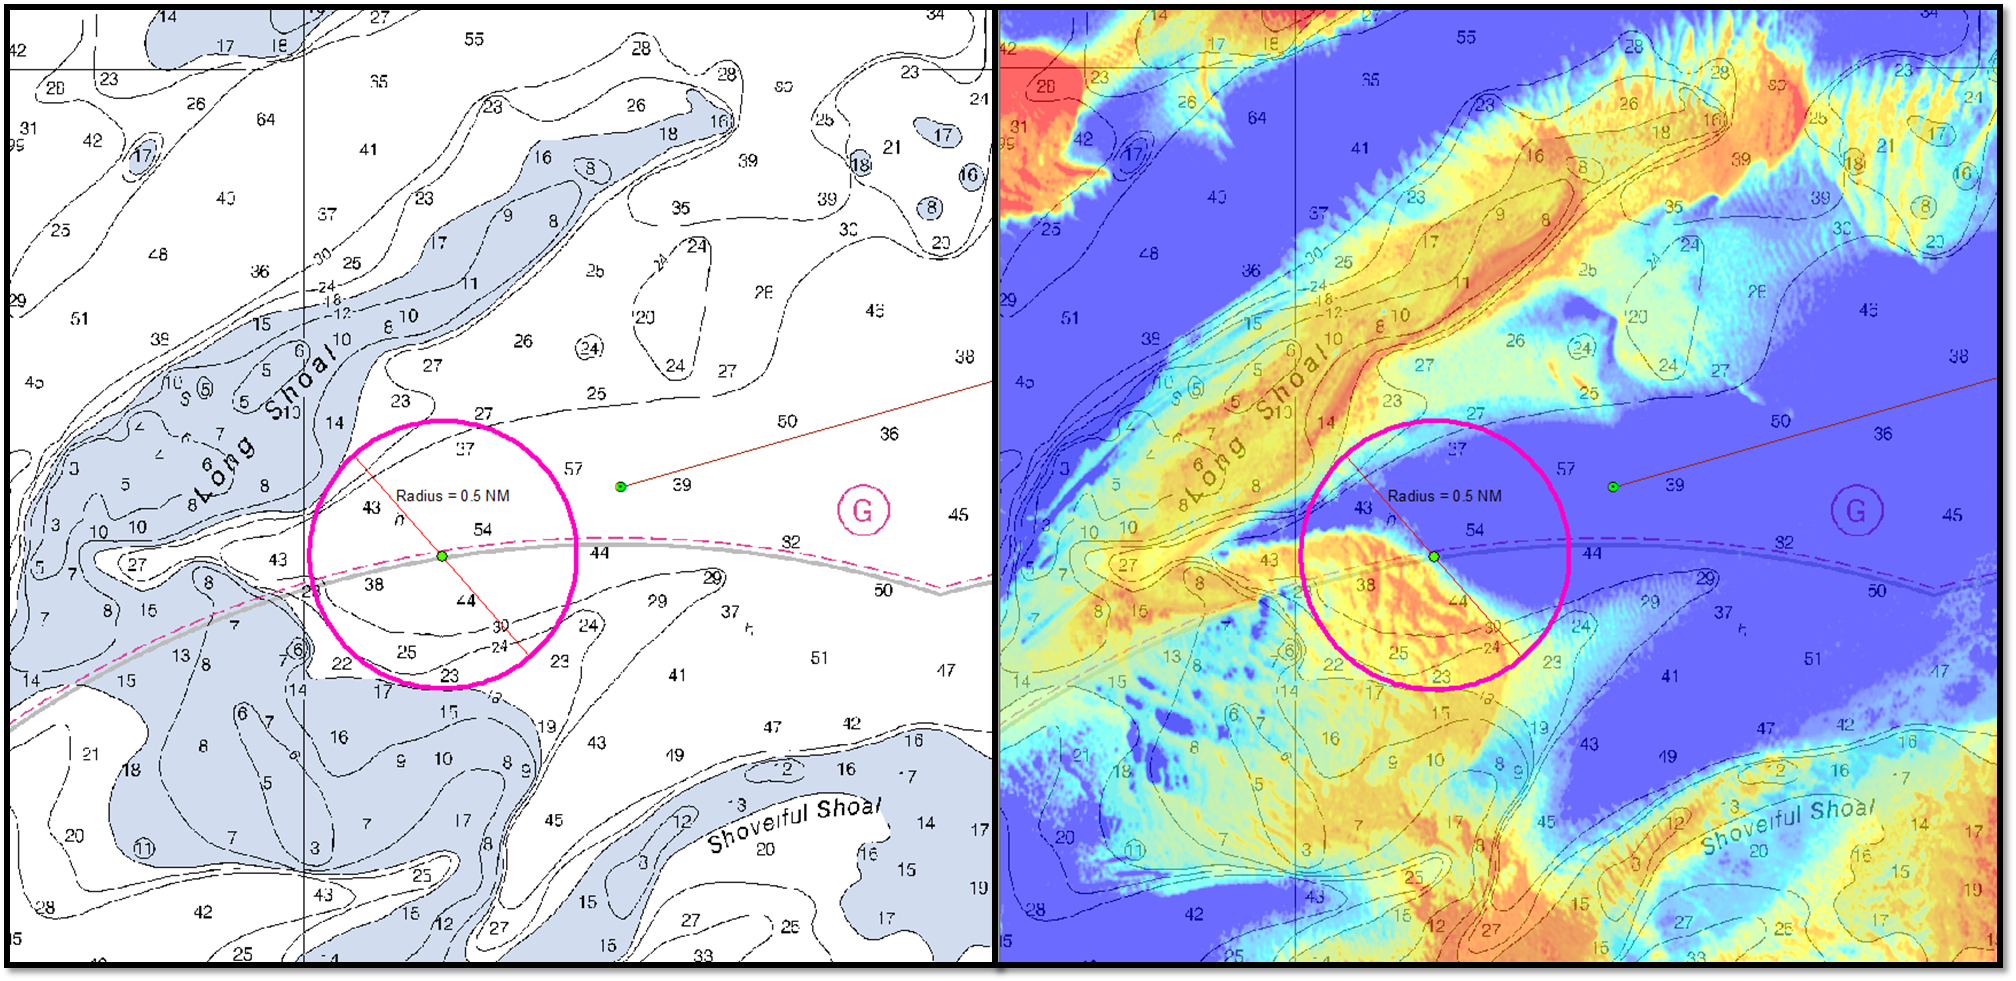
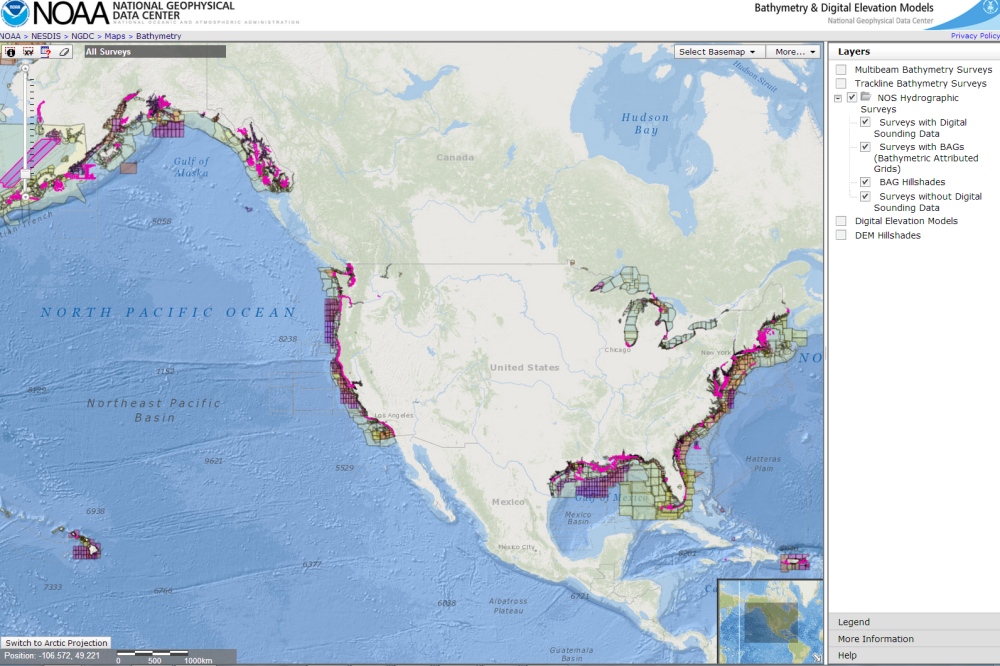
What does the age of the survey mean for nautical charts?

Vintage of Alaska survey

Alaska’s nautical charts need to be updated — we all know that. The diagram below shows the vintage of survey data currently used for today’s charts in Alaska. The graphic includes all surveys done by NOAA’s Office of Coast Survey (and its predecessors), and some limited data acquired by other agencies, i.e., the U.S. Coast Guard. Areas that are not colored in have never been surveyed or have data acquired by another source — from Russia or Japan, for instance — before the U.S. was responsible for charting in that area.
Continue reading “What does the age of the survey mean for nautical charts?”

Coast Survey announces plans for 2015 NOAA survey projects

2015 survey plan outlines

In 2015, NOAA survey ships Thomas Jefferson and Ferdinand R. Hassler are scheduled to survey nearly 1,800 square nautical miles in the U.S. coastal waters of the lower 48 states, collecting data that will update nautical charts for navigation and other uses. In Alaska, NOAA ships Fairweather and Rainier will increase their Arctic operations, planning to acquire 12,000 nautical miles of “trackline” depth measurements of the U.S. Coast Guard’s proposed shipping route. (See this NOAA article.) The ships will also conduct several “full bottom” hydrographic survey projects, acquiring data from over 2,800 square nautical miles in survey areas along the Alaskan coastline.
We are also planning several projects for our contractual private sector survey partners, and those projects will be announced after work orders are finalized.
Continue reading “Coast Survey announces plans for 2015 NOAA survey projects”

Public has new web access to NOAA hydro survey plans

With over 3.4 million square nautical miles of U.S. waters to chart, NOAA’s Office of Coast Survey is constantly evaluating long-term hydrographic survey priorities. Now, for the first time, Coast Survey is posting its three-year survey plans and making them publicly available at the Planned NOAA Hydrographic Survey Areas (2015-2017) in ArcGIS Online. In addition to seeing the outlines of planned survey areas for the next three years, users can obtain additional metadata (project name, calendar year, and area in square nautical miles) for each survey by simply clicking on the outlines. Other features display the survey area information in a tabular format, and can filter the information using metadata fields.

The new Planned NOAA Hydro Survey map color codes project areas by year. Clicking on the outline gives additional information.
The new Planned NOAA Hydro Survey Area map color codes project areas by year. Clicking on the outline gives additional information.

Continue reading “Public has new web access to NOAA hydro survey plans”

NOAA Ship Thomas Jefferson celebrates survey success with maritime community

NOAA Ship Thomas Jefferson

by Ensign Diane Perry, onboard NOAA Ship Thomas Jefferson
From 2005 through today, NOAA Ship Thomas Jefferson has been surveying Long Island Sound, one project area at a time. Some of the area was last surveyed between the late 1800s and 1939. For the 2014 field season, Thomas Jefferson was assigned her final Long Island Sound project, 89 square nautical miles of Eastern Long Island Sound, Fisher Island Sound, and Western Block Island Sound. When this project is complete, we will have resurveyed over 95% of Long Island Sound and all of Block Island Sound with modern survey technology that allows for a complete picture of the seafloor and highly accurate soundings.

This image depicts Thomas Jefferson's bathymetry from eastern Long Island Sound to Gardiner's Bay.
This image depicts Thomas Jefferson‘s bathymetry from eastern Long Island Sound to Gardiner’s Bay.

Continue reading “NOAA Ship Thomas Jefferson celebrates survey success with maritime community”

Correcting chart discrepancies at Alaska’s Whale Passage

entrance to Whale Passage

by Ensign Sarah Chappel, NOAA Ship Rainier
NOAA Ship Rainier recently surveyed Whale Passage, which separates Whale Island from Kodiak Island, Alaska. The area has never been surveyed with modern full bottom coverage methods, and some project areas were last surveyed by lead lines around a hundred years ago. The area frequently experiences 7 knot currents, making rocky or shoal areas particularly treacherous. Whale Passage is a high traffic area for fishing vessels, U.S. Coast Guard cutters, barges, ferries, and small boats, which is why updating the area’s nautical charts is so important.
Continue reading “Correcting chart discrepancies at Alaska’s Whale Passage”

NOAA improves public access to hydrographic survey descriptive reports

by Marcus Cole, Coast Survey’s Cartographic & Geospatial Technology Program
Many are familiar with hydrographic surveys used to update nautical charts.
It isn’t enough, however, to collect just bathymetry during a survey. Without the context, such as when the data was collected, what instrumentation was used, or which tide stations were used to adjust the bathymetry to a particular datum, the data can’t be compiled into a chart update. The data can’t be discovered for a fish habitat study, or an analysis of coastal erosion, or tsunami inundation modeling. And, until two years ago, this metadata (data about data) was collected in a paper document that hadn’t changed much during the last century.

Find descriptive reports from NGDC's interactive map.
Find descriptive reports from NGDC’s interactive map.

Continue reading “NOAA improves public access to hydrographic survey descriptive reports”

NOAA hydro field season underway

The 2014 hydrographic survey season is underway, with the NOAA fleet beginning its projects for this year.
Have you ever wondered how Coast Survey goes about determining where to survey and when? Several considerations go into prioritizing survey plans, which are laid out several years in advance. Coast Survey asks specific questions about each potential survey area.

  • Is it considered a critical area? If so, how old are the most current survey data?
  • Have local pilots or port authorities submitted reports of shoaling, obstructions or other concerns?
  • Does the U.S. Coast Guard or other stakeholders from the maritime community (e.g., fisheries, energy, pipelines) need surveys for economic development or ecological protection?

Coast Survey’s 2014 projects reflect these priorities.
Continue reading “NOAA hydro field season underway”

Navigation Response Team 1 finds vehicle during survey of Intracoastal Waterway, assists sheriff’s office

While surveying the approaches to Panama City (FL), St Andrews Bay, and West Bay, Coast Survey’s Navigation Response Team 1 recently made an unexpected find. When team members Mark McMann and Aurel Piantanida reviewed hydrographic data collected with their side scan sonar and multibeam echo sounder, they discovered an upside-down vehicle in Panama City’s West Bay Creek, part of the Intracoastal Waterway (see chart 11385).

NRT 1's multibeam echo sounder captures the submerged car's image.
NRT1’s multibeam echo sounder captures the submerged car’s image.

Continue reading “Navigation Response Team 1 finds vehicle during survey of Intracoastal Waterway, assists sheriff’s office”

Beyond the charts: geological highlights from NOAA’s 2013 hydrographic field season in Alaska

–By Christy Fandel, Coast Survey physical scientist
Have you ever wondered what lies beneath the charted soundings on a nautical chart? While surveying Alaskan waters during the 2013 hydrographic field season, collecting bathymetry to update NOAA’s nautical charts, hydrographers revealed many interesting geologic features on the seafloor.
NOAA focuses a significant portion of our ocean mapping effort along the Alaskan coast. The Alaskan coastline represents over 50% of the United States coastline and dated nautical charts are inadequate for the increasing vessel traffic in this region. NOAA surveys are essential for providing reliable charts to the area’s commercial shippers, passenger vessels, and fishing fleets.
This past season, NOAA-funded hydrographic surveys in Alaska revealed many interesting geological features on the seafloor. Three surveys, in particular, took place in southeastern Alaska in the Behm Canal, along the Aleutian Chain within the coastal waters surrounding Akutan Island, and around Chirikof Island.

These three areas were surveyed by the NOAA Ship Rainier and surveying contractor Fugro-Pelagos during the 2013 field season.
These three areas were among the areas surveyed by the NOAA Ship Rainier and surveying contractor Fugro-Pelagos during the 2013 field season.

Continue reading “Beyond the charts: geological highlights from NOAA’s 2013 hydrographic field season in Alaska”

NOAA navigation response teams improve charts for ships transiting Miami and San Francisco

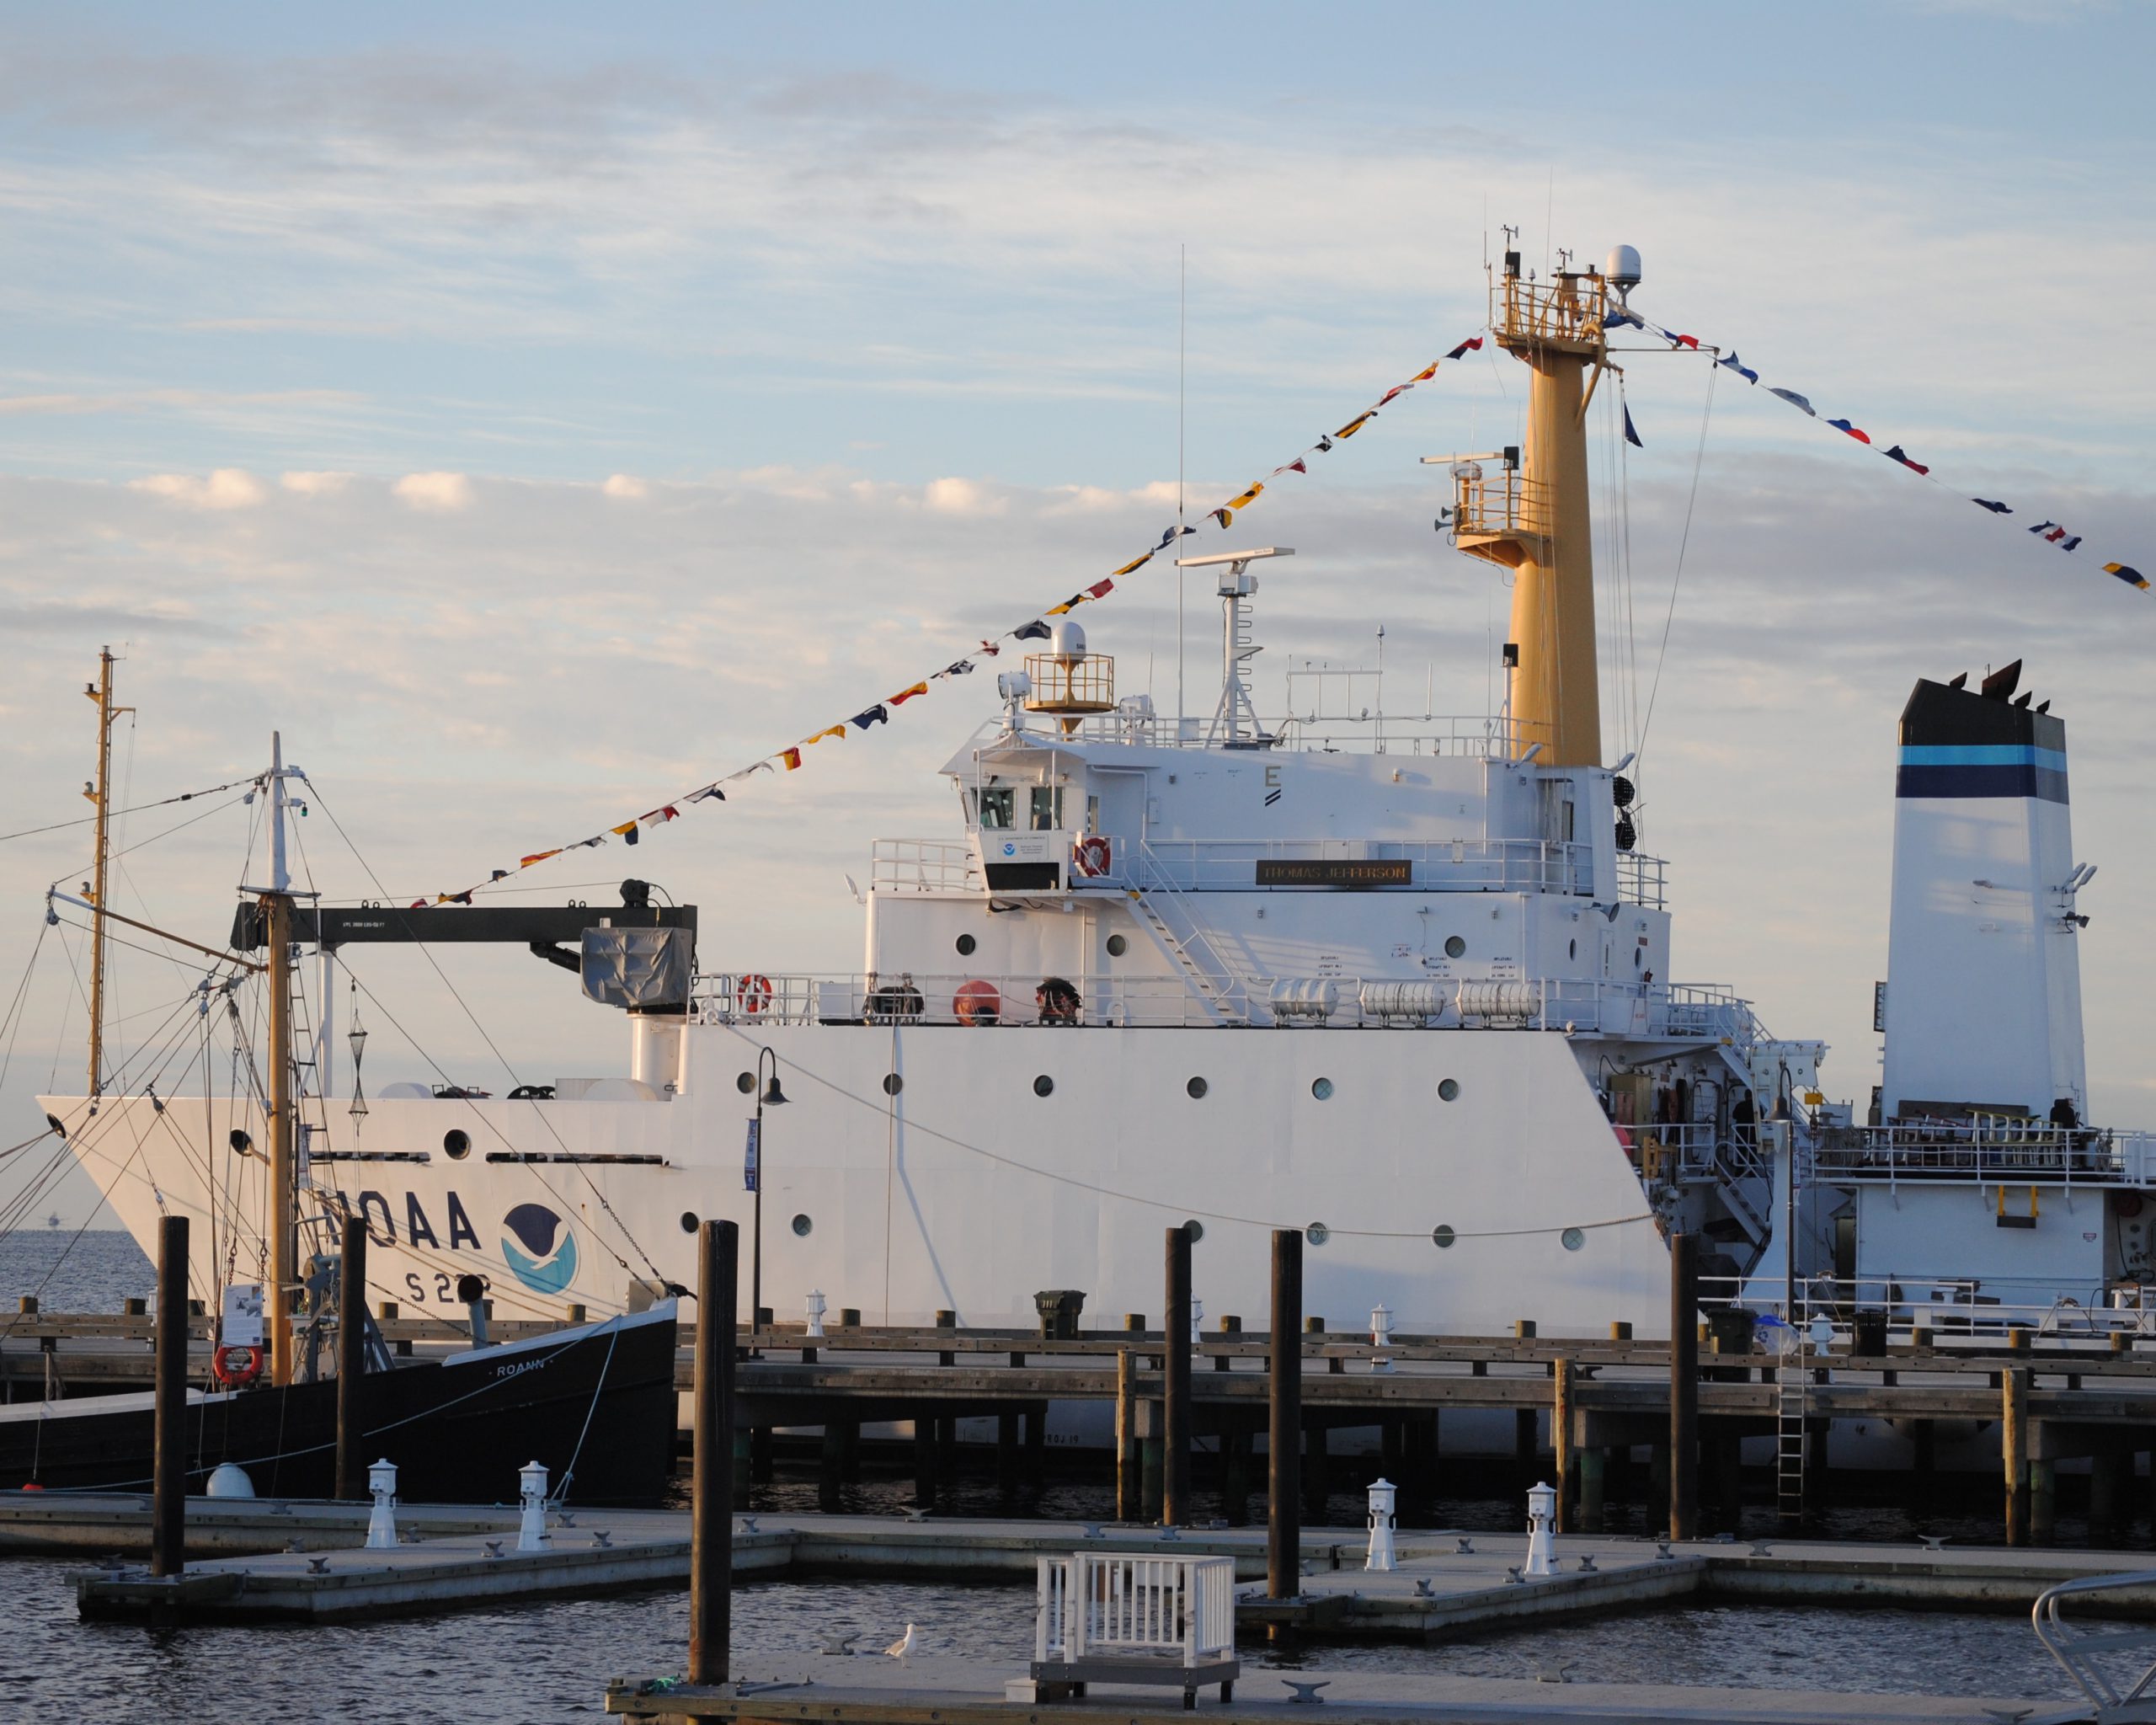
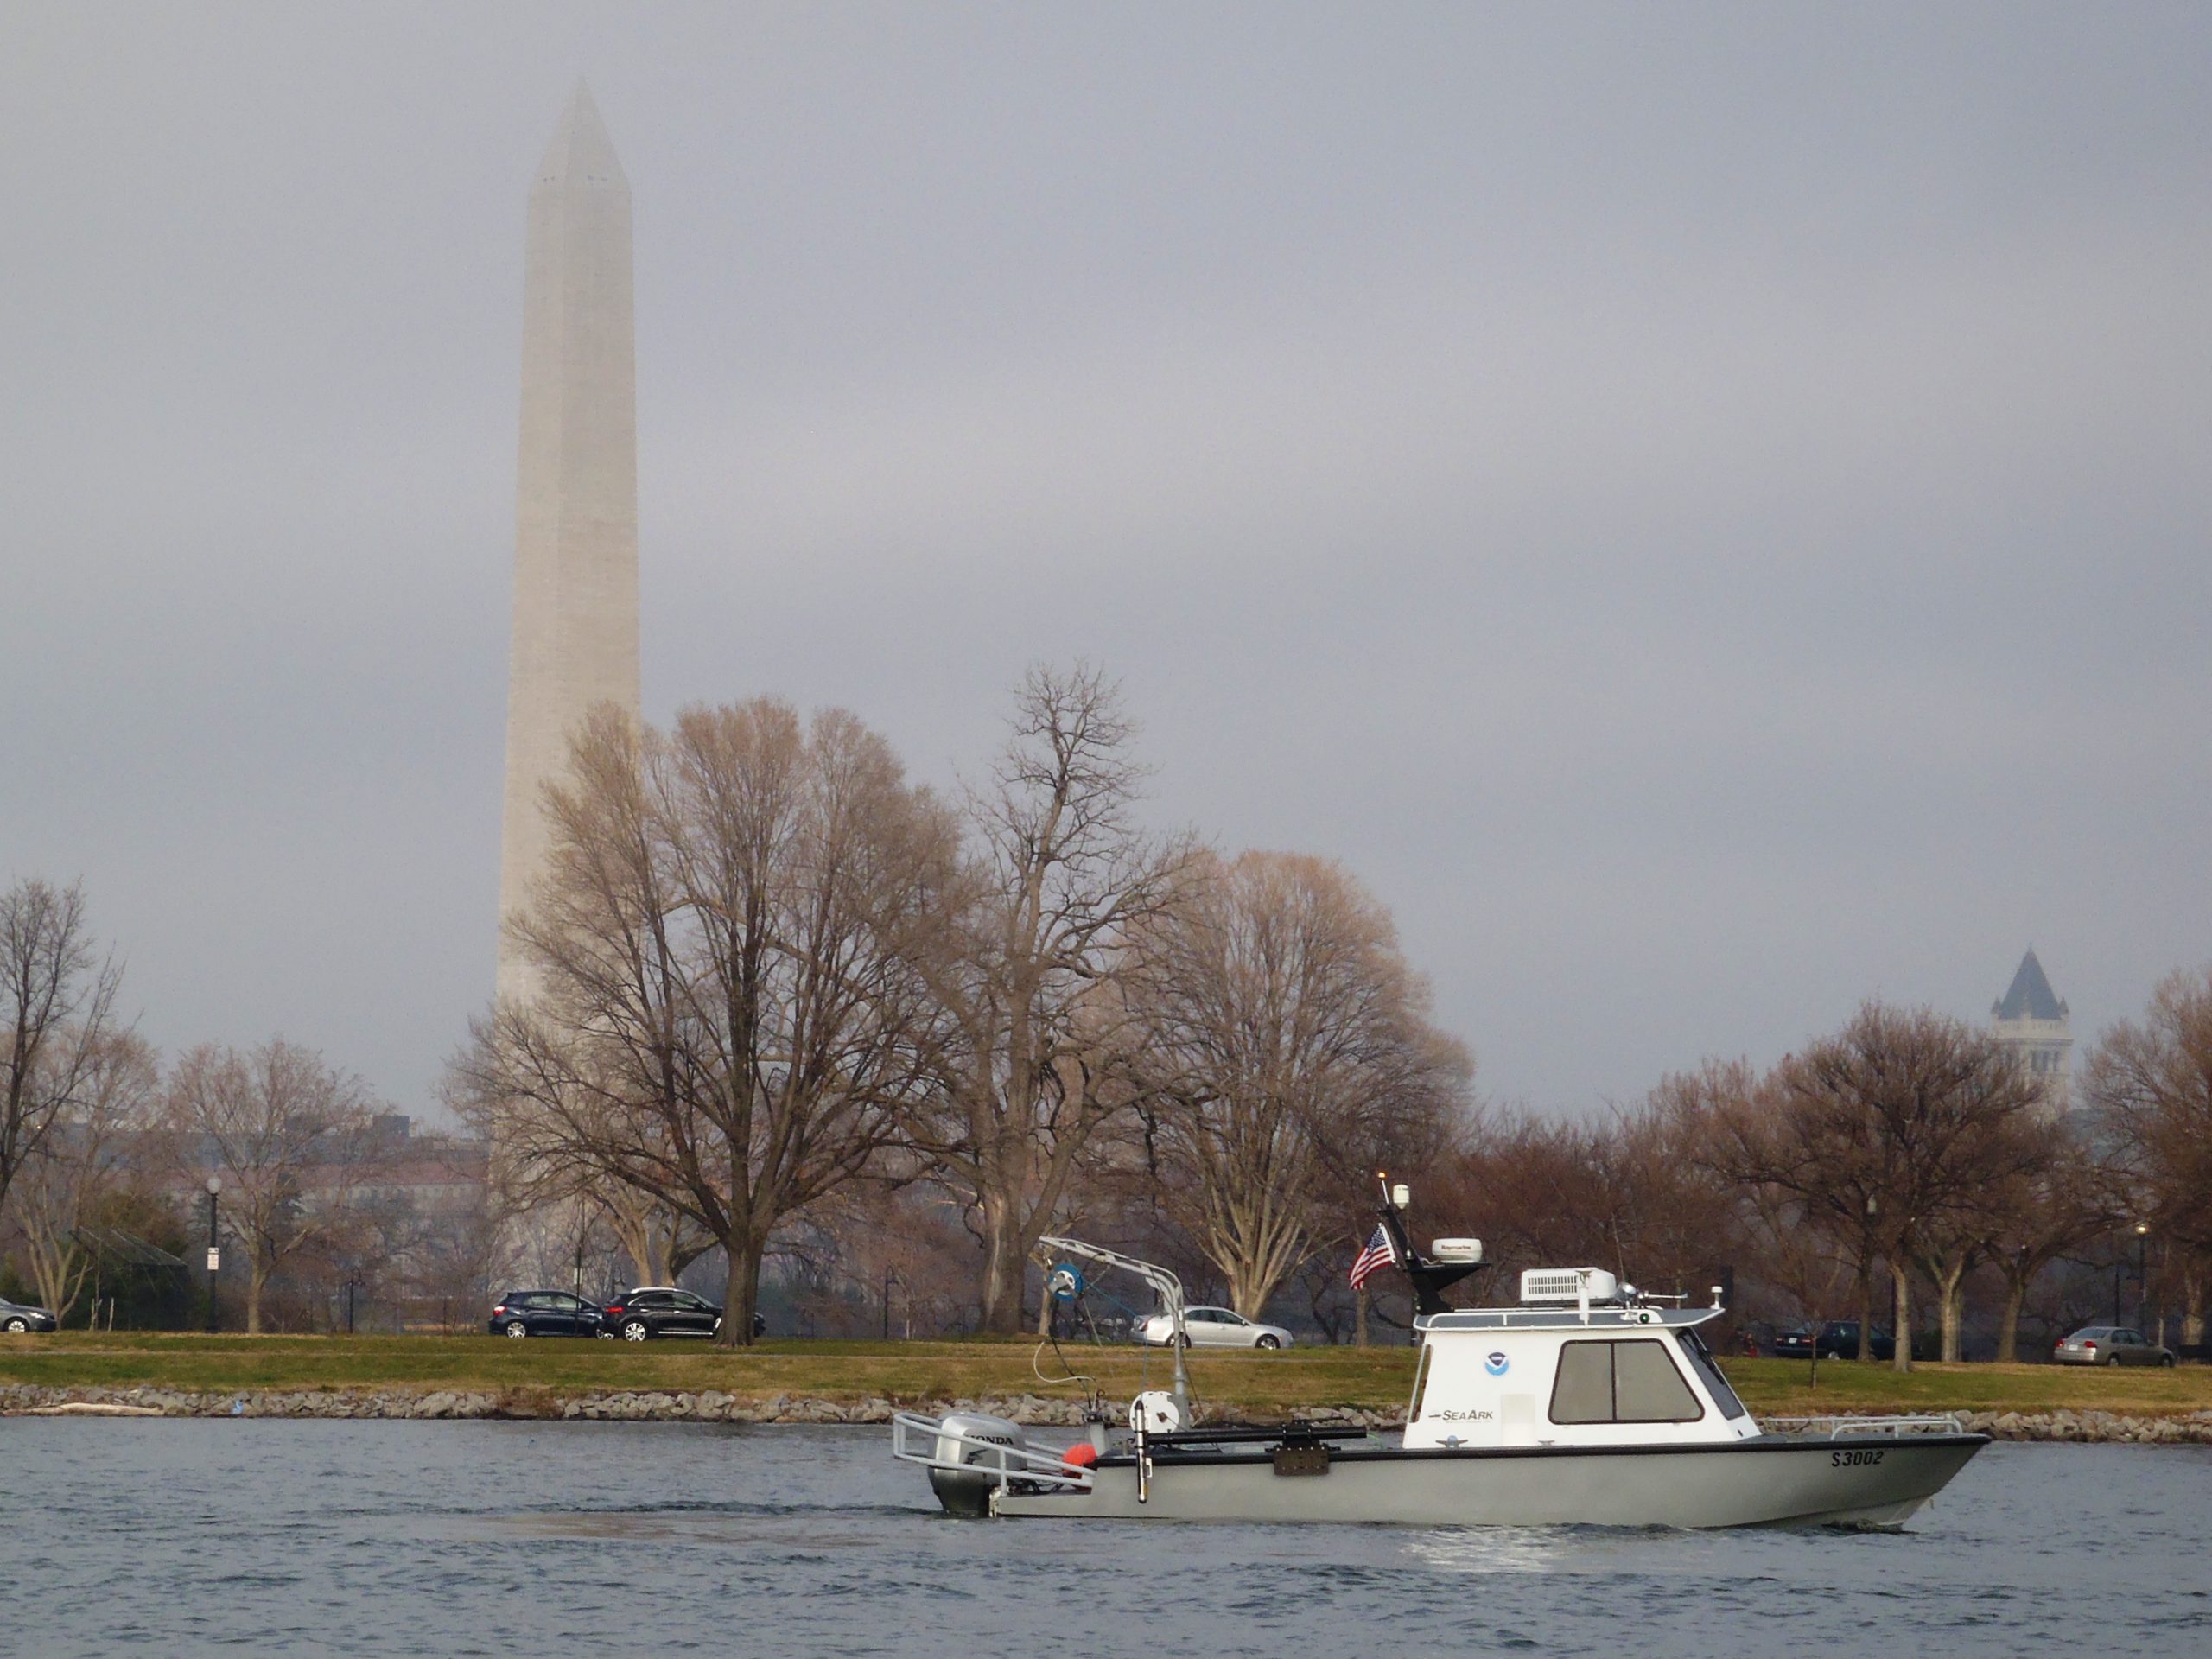
Coast Survey’s navigation response teams, which are 3-person hydrographic survey teams on small boats, have made a fast start on this year’s survey season.
In Florida, where Coast Survey is preparing to issue a “new and improved” Miami Harbor Chart 11468 to alleviate vessel congestion at the Port of Miami, a navigation response team finished final hydrographic surveys to ensure the new chart has the latest and most accurate depth measurements around several areas identified as critical within the port. In just ten days, team members Erik Anderson, James Kirkpatrick, and Kurt Brown acquired, processed, and submitted the multibeam survey data covering 64 nautical miles.

NRT2 Miami survey
NOAA Navigation Response Team 2 just finished up this survey in Miami

Continue reading “NOAA navigation response teams improve charts for ships transiting Miami and San Francisco”