Explore the refreshed ENC-based NOAA Custom Chart Tool

Updated user interface of the NOAA Custom Chart (NCC) prototype web application displaying the Cape Cod, Massachusetts, region.

Recently, NOAA released an improved user interface for the NOAA Custom Chart (NCC) prototype web application, a tool that allows users to create their own charts from the latest NOAA electronic navigational chart (NOAA ENC®) data. In this refreshed version, NCC settings are simplified and more logically organized, appropriate default values for depth contour labels, depth shades, and compass roses are set, and the NOAA color palette from traditional NOAA paper charts is implemented.

Continue reading “Explore the refreshed ENC-based NOAA Custom Chart Tool”

NOAA supports arrival of USNS Comfort to New York City

USNS Comfort

For more than 200 years, nautical cartographers have methodically charted our nation’s coastline, adding new features or hazards and updating meandering shorelines, all in an effort to aid safe navigation. However, occasions do arise that require immediate charting, particularly in response to national emergencies. Notable examples include charting the projected oil spill zone during the Deepwater Horizon oil spill disaster, as well as hazards during hurricane response efforts. Most recently, NOAA’s Office of Coast Survey was called upon to support the arrival of USNS Comfort to New York City.

Continue reading “NOAA supports arrival of USNS Comfort to New York City”

NOAA certifies San Francisco Bay shipping channel with top survey rating, increasing confidence for deep draft vessel navigation

Tanker heading west and approaching the Richmond–San Rafael Bridge and Pinole Shoal Channel.

There is a risk factor when navigating in and out of our nation’s busiest ports, particularly at the helm of some of the world’s largest deep draft vessels. Mariners rely on tide and water level information, wind and weather data, but perhaps most importantly, they rely on electronic navigational charts and the quality of depth measurements that comprise them. Recently, NOAA’s Office of Coast Survey certified the U.S. Army Corps of Engineers (USACE) hydrographic surveys for the Pinole Shoal Channel in San Francisco Bay —  a critical waterway for bulk carriers and tankers to reach the ports of Sacramento, Stockton, Martinez, and Benicia — the highest possible data quality rating, Category Zone of Confidence (CATZOC) A1, for two years. This is the first USACE federally-maintained channel to receive the highest-level certification. NOAA anticipates the increased CATZOC rating will dramatically increase shipping efficiency.

Continue reading “NOAA certifies San Francisco Bay shipping channel with top survey rating, increasing confidence for deep draft vessel navigation”

Nautical Charts: Marine Navigation Joins the Geospatial Revolution

Electronic navigational chart displayed on an Electronic Chart Display and Information System (ECDIS) on NOAA Ship Thomas Jefferson.

By Rear Adm. Shepard M. Smith

When I traveled around Europe as a young man, my first stop upon leaving the train station in a new city was at the tourist bureau kiosk for a paper city map. On a recent trip to Malaysia, I used my phone to find walking instructions to a street market across town. When I arrived, I described my route to my host, who said that the pedestrian bridge I had used only opened the week before.

Continue reading “Nautical Charts: Marine Navigation Joins the Geospatial Revolution”

The Great Lakes are getting a digital upgrade

Screenshot of an ENC for the Pelee Passage Southeast Shoal.

NOAA’s Office of Coast Survey collaborated with U.S. and Canadian mariners, the Lake Carriers’ Association (LCA), and the Canadian Chamber of Marine Commerce (CMC) to update the Recommend Courses in Lake Erie and transfer them from paper charts to NOAA electronic navigational charts (NOAA ENC®). This bi-national effort involved compiling and updating information for Lake Erie’s 75 routes which span both U.S. and Canadian waters. These routes cover 20 NOAA and five Canadian ENCs.

Continue reading “The Great Lakes are getting a digital upgrade”

NOAA releases 2020 hydrographic survey season plans

NOAA 2020 Hydrographic Survey Season Story Map Cover

NOAA hydrographic survey ships and contractors are preparing for the 2020 hydrographic survey season. The ships collect bathymetric data (i.e. map the seafloor) to support nautical charting, modeling, and research, but also collect other environmental data to support a variety of ecosystem sciences. NOAA considers hydrographic survey requests from stakeholders such as marine pilots, local port authorities, the Coast Guard, and the boating community, and also consider other hydrographic  and NOAA science priorities in determining where to survey and when. Visit our “living” story map to find out more about our mapping projects and if a hydrographic vessel will be in your area this year!

Continue reading “NOAA releases 2020 hydrographic survey season plans”

One year later – Coast Survey’s response to the Anchorage earthquake

Multibeam data acquired by eTrac in Knik Arm, offshore of Anchorage.

By Lt. Cmdr. Bart Buesseler

At 8:29, on the morning of Friday, November 30, 2018, a magnitude 7.1 earthquake shook Anchorage, Alaska, for thirty stressful seconds. It was the largest earthquake in Anchorage since the Good Friday Quake of 1964, and brought Alaska’s most populated city to a standstill as residents evacuated buildings and came to terms with what they had just experienced.

Continue reading “One year later – Coast Survey’s response to the Anchorage earthquake”

Coast Survey Spotlight: Meet Kolleen Mortimer

Kolleen Mortimer standing on the banks of the Elizabeth River in Portsmouth, Virginia.

Ever wonder what it’s like to be a member of the NOAA Coast Survey team? We use the Coast Survey spotlight blog series as a way to periodically share the experiences of Coast Survey employees as they discuss their work, background, and advice.


Kolleen Mortimer, Physical Scientist

“Knowing the data we examine every day contributes to safe navigational products is greatly rewarding. It’s also rewarding to see the process come to life in a greater scope. When the data leaves my desk and makes it to a chart product, I can say that my work contributed to that.”

Continue reading “Coast Survey Spotlight: Meet Kolleen Mortimer”

Register for NOAA Nav-cast webinar: NOAA’s nowCOAST

Image announcing Nav-cast webinar.

UPDATE: The Nav-cast scheduled for 9/26 at 1 p.m. (EDT) is cancelled and will be rescheduled at a later date. We apologize for the inconvenience.

Join us for our next NOAA Nav-cast, a quarterly webinar series that highlights the tools and trends of NOAA navigation services.

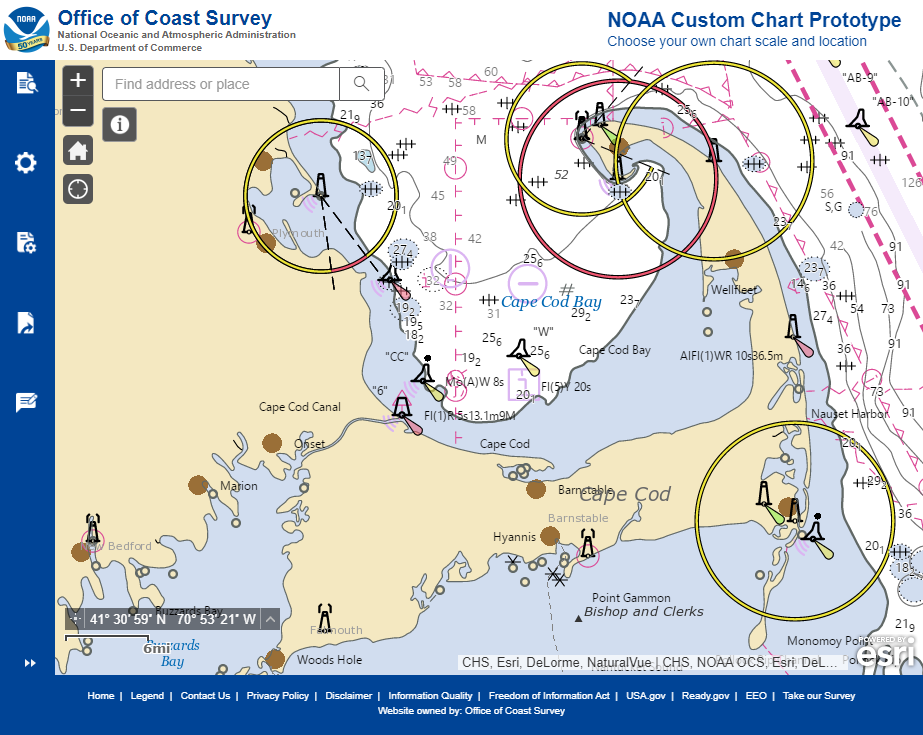
NOAA’s nowCOAST: A one-stop-shop for coastal conditions before you head out on the water

NOAA’s nowCOAST (nowcoast.noaa.gov) — a free online interactive map viewer —provides situational awareness on present and future weather and oceanographic conditions for mariners and other coastal users by integrating data from across NOAA and regional observing systems. Users can assess present conditions by creating maps of the latest in-situ weather/marine weather observations, weather radar mosaics, cloud images from GOES weather satellites, and surface wind and sea-surface temperature analyses for the last few hours. Users can also obtain maps of critical weather/marine weather advisories, watches, and warnings, weather forecasts, tropical cyclone track and intensity forecasts, and forecast guidance of water levels, water temperature, salinity, and currents from NOAA oceanographic forecast models.  Users can display these maps using the nowCOAST map viewer or by connecting to its map services. nowCOAST operates in a high-availability hosting facility and is monitored 24 x 7.

Continue reading “Register for NOAA Nav-cast webinar: NOAA’s nowCOAST”

NOAA supports safe ferry transit in Puget Sound

NRT-Seattle with the F/V Salish.

By Lt. j.g. Michelle Levano

If you have spent time on the water in Puget Sound, you have probably seen the large, distinct green and white vessels. These vessels move passengers, vehicles, and cargo across Puget Sound to the San Juan Islands and to Victoria, Canada, year round. They are a part of the Washington State Department of Transportation ferry system. The state has been operating ferries since 1951, and intended to run the ferry service until cross Sound bridges could be built.  These bridges were never built, and the state continues to operate the ferries to this day. As of last July, there are 22 state-operated ferries on Puget Sound, with the largest vessel able to carry 2500 passengers and 202 vehicles. 

Continue reading “NOAA supports safe ferry transit in Puget Sound”