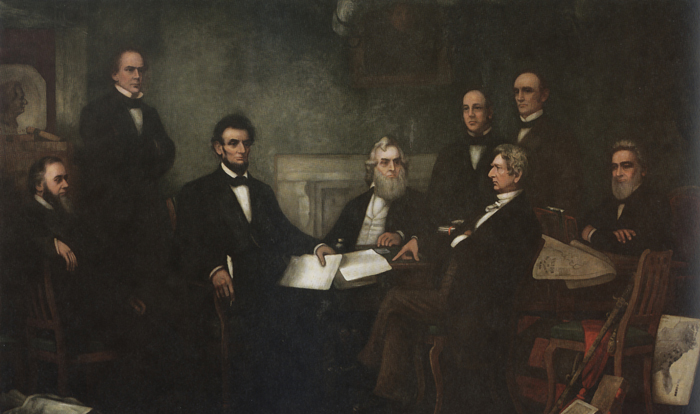
The “slave density map,” created by the men of U.S. Coast Survey in 1861, is one of Coast Survey’s most treasured historical maps. Artist Francis Bicknell Carpenter included it in his painting, “First Reading of the Emancipation Proclamation of President Lincoln,” because Lincoln consulted it so often in devising his military strategy. According to Carpenter, President Lincoln used the map in his decisions to send his armies to free blacks in some of the highest density areas in order to destabilize Southern order.

President Lincoln’s Cottage, now maintained by the National Trust for Historic Preservation, is where President Lincoln developed the Emancipation Proclamation. So it was fitting that, on Lincoln’s birthday this year, NOAA’s Office of Coast Survey presented a copy of the map to Cottage officials, to assist with their vital educational programs.
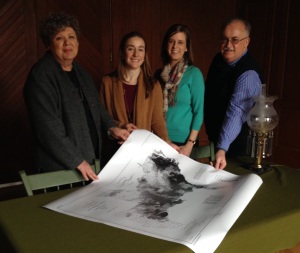
In the very library where Lincoln may have studied the map, Coast Survey’s Dawn Forsythe (left) and NOAA’s Ben Sherman (right) presented the map to Erin Carlson Mast, the Cottage’s executive director, and Callie Hawkins, associate director for programs.
The Cottage plans to use the map in their educational programs. To learn more about the map, see Mapping Slavery in the Nineteenth Century.


News and Updates
Was there a comparable map drawn up showing the percentage of slavery in the Northern States?
Nancy, the Smithsonian Magazine has a good article, “These Maps Reveal How Slavery Spread Across the United States.” http://www.smithsonianmag.com/history/maps-reveal-slavery-expanded-across-united-states-180951452/?no-ist