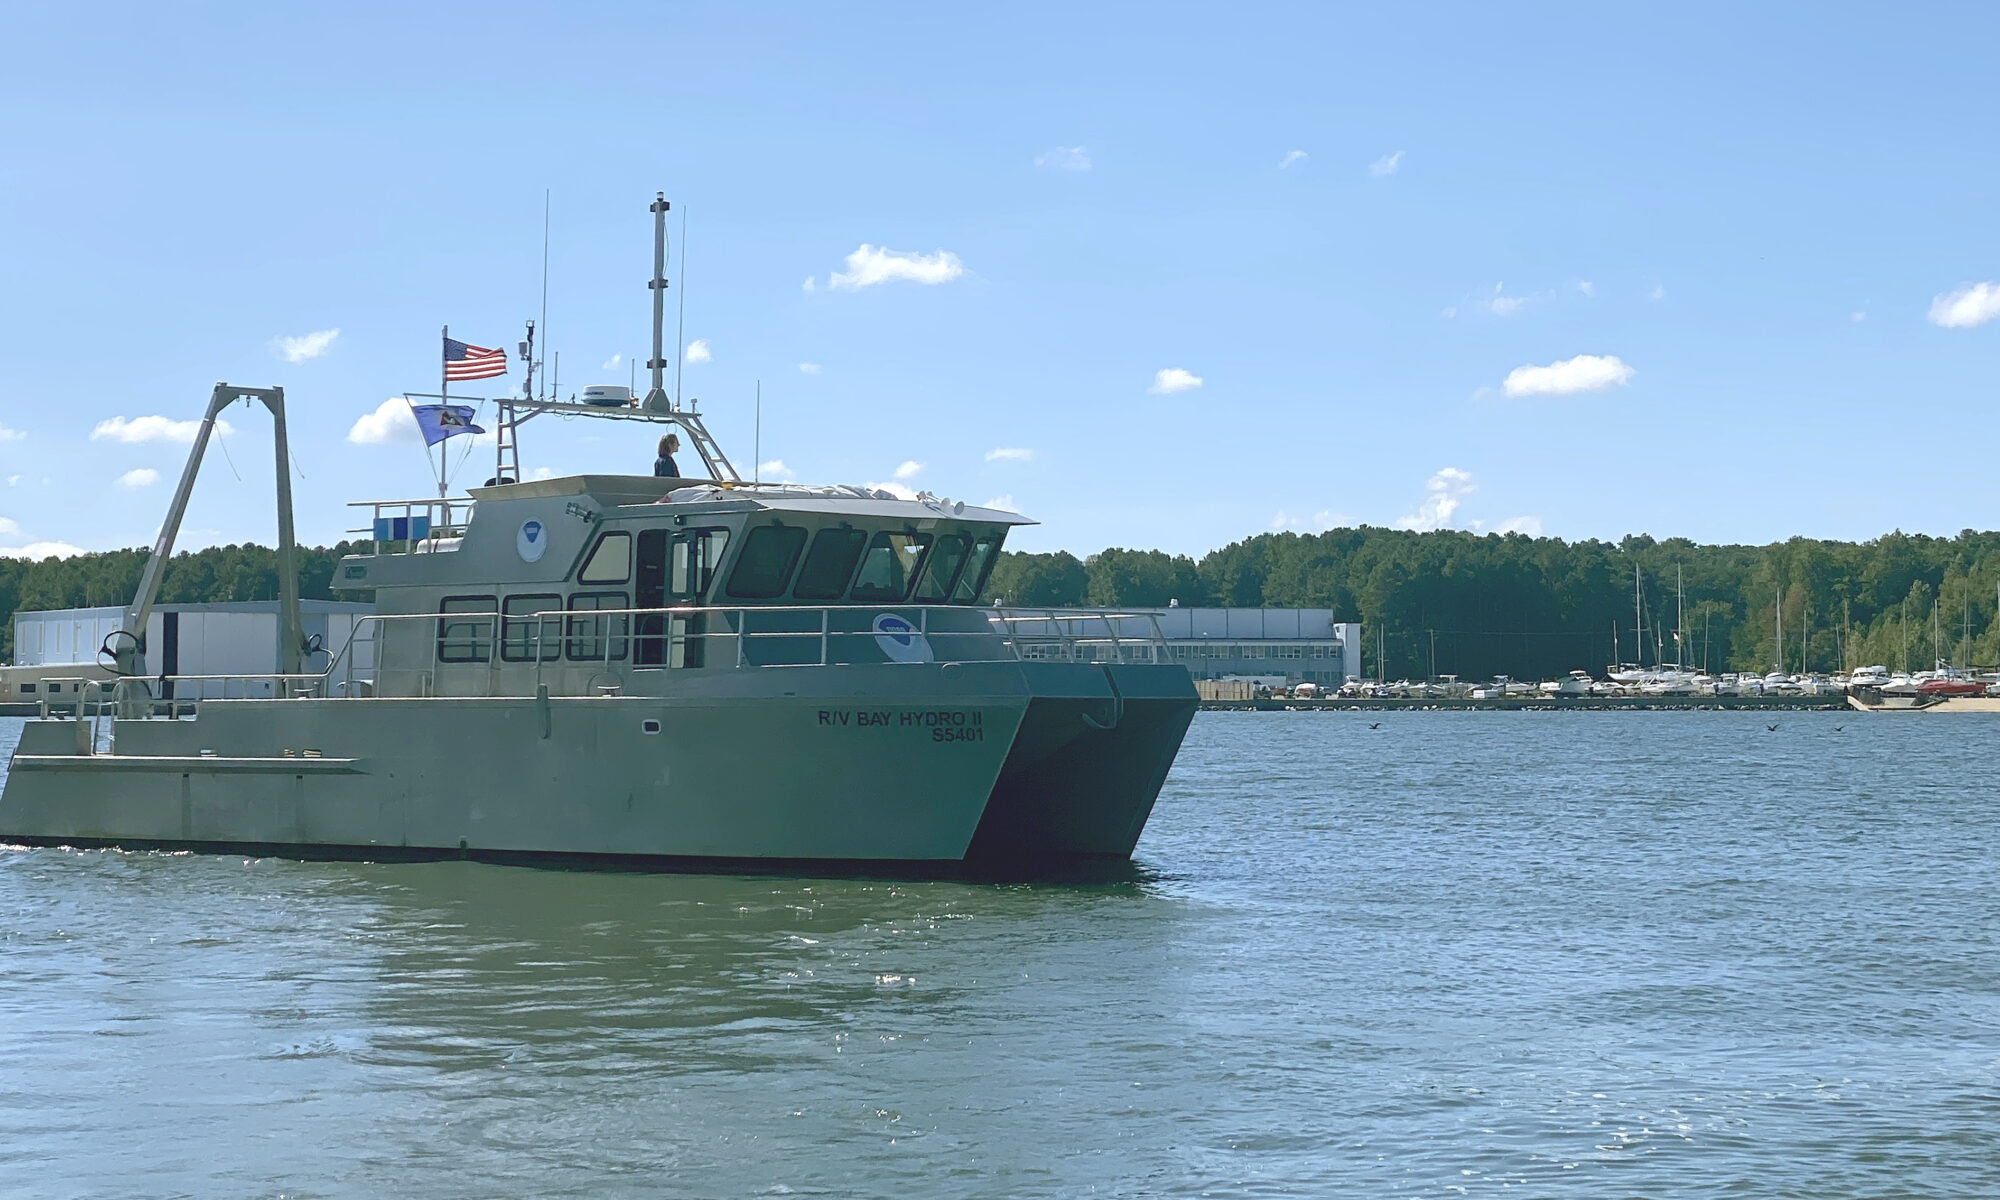
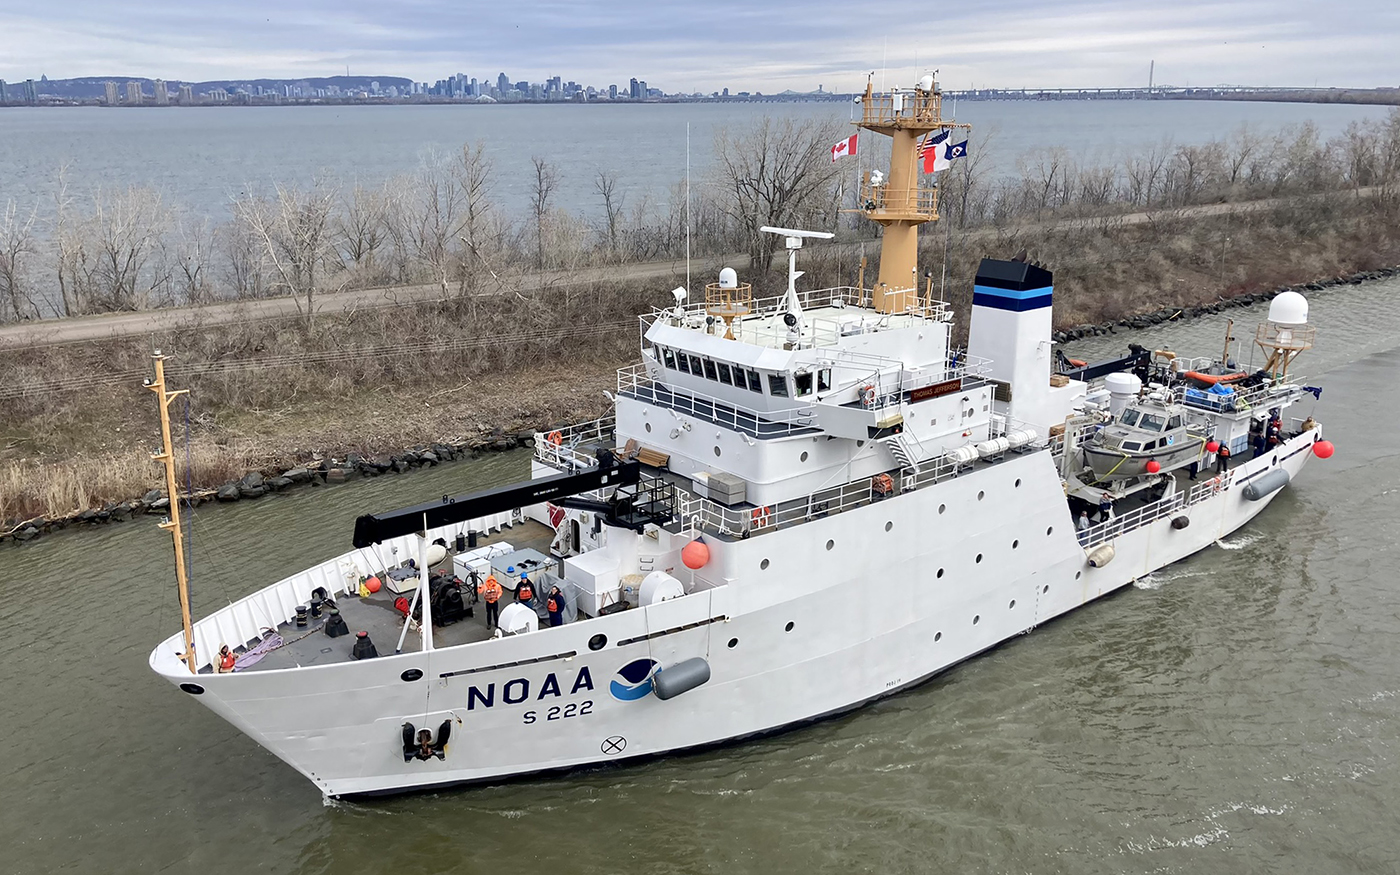
Bringing nautical charts of the Erie Canal into the digital era

The construction of the Erie Canal was one of 19th Century America’s most significant feats of engineering. Built between 1817 and 1825, the canal provided a water route from Albany to Buffalo, New York, nearly 363 miles to the west. The Canal connected the Hudson River with the Great Lakes via parts of the Mohawk River, through various land cuts and natural lakes. The New York State Public Works Department and the US War Department’s Corps of Engineers began geographically documenting the canal’s route with maps and nautical charts beginning in 1917. The Department of Commerce’s National Oceanic and Atmospheric Administration took ownership of the charts in the early 1970’s and has maintained and updated them for over 50 years. Currently, these charts are undergoing changes to usher them into the digital era of electronic navigational charts.

Check out our digitizing the Erie Canal ArcGIS StoryMap linked here or click the image below!

An image showing the Erie Canal at Waterford, New York during a festival.
An image showing the Erie Canal at Waterford, New York during a festival. Credit: Erie Canalway National Heritage Corridor/Halldor K. Sigurdsson.

Surveying the Pribilof Islands, from Pathfinder to Fairweather

Two images of Pathfinder and Fairweather lined up side by side.

By Lt. Taylor Krabiel

In the 1950s, U.S. Coast and Geodetic Survey (USC&GS) Pathfinder surveyed the Pribilof Islands with the latest technologies to chart previously unsurveyed waters and bring the islands into a common datum with the mainland. Fast forward 71 years and NOAA Ship Fairweather continues this work. Despite the decades and technologies that separate the two ships, they share many commonalities in their mission and their surveying techniques.

Continue reading “Surveying the Pribilof Islands, from Pathfinder to Fairweather”

Vessel pilots transition to new chart format

NOAA’s Precision Marine Navigation (PMN) program aims to seamlessly integrate high-resolution bathymetry and high accuracy positioning and shoreline data with the forecast data of water levels, currents, waves, and weather forecasts. This information can be easily accessed and integrated into maritime electronic charting systems and other decision support tools so mariners can plan their transits and make decisions while at sea and coming to and from port. A key component of this program is providing vessel pilots with detailed depth information to ensure safety of vessel transits and that critical under keel clearance safety margins are maintained. Electronic navigational charts, although accurate, typically do not provide the detail that pilots prefer.

Continue reading “Vessel pilots transition to new chart format”

Research vessel Bay Hydro II makes history on Mayland’s Elk River

NOAA survey vessel Bay Hydro II in it's homeport at the Patuxent River Naval Air Station.
By Lt.j.g. Carly Robbins, junior officer in charge R/V Bay Hydro II

Situated on the east side of the Chesapeake Bay, 162 nautical miles above the Virginia Capes, Elk River is the western approach to the Chesapeake and Delaware Canal. The canal is one of the busiest waterways in the country. It connects the Chesapeake and Delaware Bays, servicing the ports of Baltimore, Wilmington, and Philadelphia. The U.S. Army Corps of Engineers regularly surveys the dredged channels in the approaches and in the canal, but they are not responsible for the remaining waters of the Elk River. The Elk River was last surveyed in the early 1900s, making depths on the nautical chart close to 100 years old! As a result, NOAA R/V Bay Hydro II was tasked to conduct a modern hydrographic survey of Elk River in Spring 2023.

Continue reading “Research vessel Bay Hydro II makes history on Mayland’s Elk River”

Help keep nautical charts up to date through citizen science

A graphic showing an artistic Citizen Science banner.

NOAA maintains a suite of nearly 2000 electronic navigational charts (NOAA ENC®), as well as the ten volume United States Coast Pilot®. The seafloor and coastline are dynamic environments, which means that our products are constantly scrutinized for possible changes. Each year we make thousands of updates to ENCs, ensuring we are providing the most accurate products possible. The source data for most of these updates comes from NOAA or contractor surveys or from our federal partners, such as the U.S. Army Corps of Engineers and the U.S. Coast Guard. However, we also rely on many other data sources to help keep our ENCs up-to-date.

Continue reading “Help keep nautical charts up to date through citizen science”

Surveying south of Cape Cod, Massachusetts in transit to the Great Lakes

NOAA Ship Thomas Jefferson underway in the Chesapeake Bay performing pre-season testing.

By Hydrographic Assistant Survey Technician Sarah Thompson

April 10, 2022 marked the beginning of NOAA Ship Thomas Jefferson and her crew’s field season and transit up through the St. Lawrence River, Lake Ontario, and into Lake Erie. This field season, Thomas Jefferson’s base of operations will be in Cleveland, Ohio and has the distinction of being the first NOAA ship to survey the Great Lakes in over 30 years. On the way, Thomas Jefferson had the opportunity to respond to a U.S. Coast Guard request to survey and obtain modern bathymetry on Pollock Rip Channel off the Massachusetts coast.

Continue reading “Surveying south of Cape Cod, Massachusetts in transit to the Great Lakes”

Have it your way – creating customized nautical charts using the latest data

An image showing the output of the NOAA Custom Chart application with a chart covering the western side of the Chesapeake Bay.

Nautical charts have always contained a great amount of information – even more so with electronic navigational charts. This information is constantly being updated, necessitating the need to keep your nautical chart suite as current as possible. The Office of Coast Survey’s online NOAA Custom Chart application enables users to create nautical charts directly from the latest official NOAA electronic navigational chart (NOAA ENC®) data. Users now have the ability to create their own nautical charts using individually set parameters, and then save this custom nautical chart as a file that can be viewed or printed.

Continue reading “Have it your way – creating customized nautical charts using the latest data”

NOAA focuses on the Great Lakes for the 2022 field season

NOAA Ship Thomas Jefferson shown from the bridge wing of a passing ship outside of Montreal, Quebec.

In 2022, NOAA and NOAA contractors will survey U.S. coastal waters and beyond, including multiple missions in the Great Lakes. As the volume, value and size of marine vessels in U.S. waters continues to grow, it is essential that NOAA increase the accuracy and frequency of surveys. A great amount of data on nautical charts of the Great Lakes is more than 50 years old, and only about 5 to 15 percent of the Great Lakes are mapped to modern standards using remote sensing methods such as light detection and ranging and sound navigation and ranging.

Continue reading “NOAA focuses on the Great Lakes for the 2022 field season”

Coast Survey launches NOAA Chart Display Service

This is a graphic showing an electronic navigational chart depicting the entrance to the Columbia River and Astoria, Oregon. Graphical information on the chart is rendered by the new NOAA Chart Display Service and shows traditional paper chart symbols.

The new NOAA Chart Display Service (NCDS) renders NOAA electronic navigational chart (NOAA ENC®) data with “traditional paper chart” symbology in online and offline applications for which a basemap of nautical chart data is desired, including GIS, web-based, and mobile mapping applications. The new service uses symbols, labels, and color schemes familiar to those who have used NOAA paper nautical charts or the NOAA Custom Chart application. NCDS is available as Esri REST Map Service, OGC Web Map Service (WMS), and MBTiles formats.

Continue reading “Coast Survey launches NOAA Chart Display Service”