NOAA navigation response team investigates hazardous shoal off Rockaway Point, NY

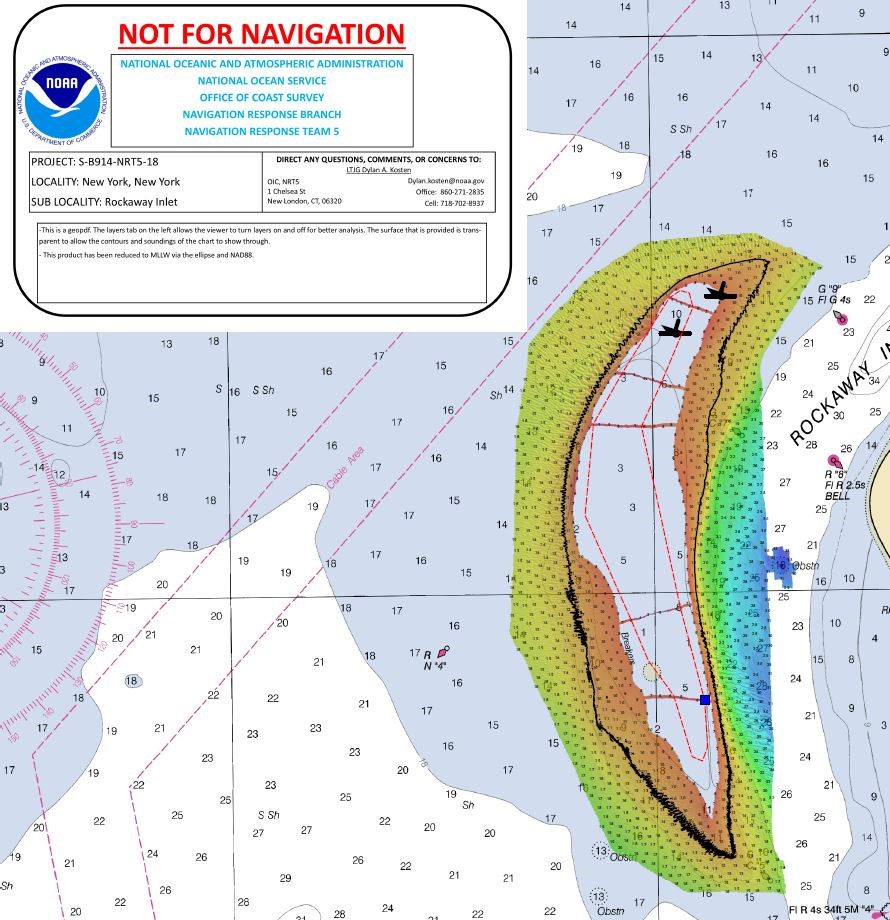
Recently, NOAA navigation response team 5 (NRT5), responded to a survey request from U.S. Coast Guard (USCG) Sector New York following several groundings near Rockaway Point in Queens, New York. Waves and currents often influence the size and shape of nearshore sandbars, and the USCG was concerned that a sandbar may have expanded beyond the area depicted on the nautical chart. Lt. j.g. Dylan Kosten, Eli Smith, and Michael Bloom traveled from New London, Connecticut, to Jersey City, New Jersey, to launch their vessel and start the survey of the area.

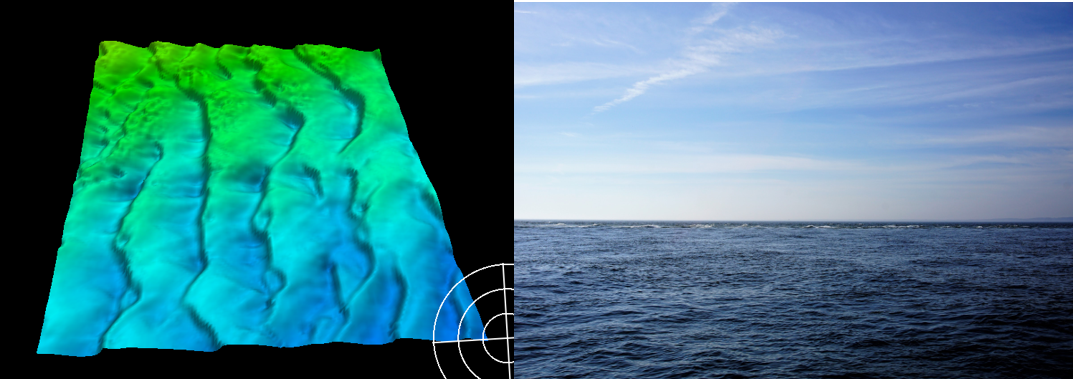
The location of the shoal and characteristics of the sandbar created challenging conditions for the survey team. In addition, the crew was asked to survey at a tighter contour (6-foot) than the standard 4-meter (13.1-foot) contour so that they could more clearly define the boundaries of the shoal. To fulfill this requirement, the crew of NRT5 took strong precautions to mitigate risks associated with surveying in shallow water with breaking waves and strong currents, and closely monitored conditions for changes throughout the day.

The shoal, located off Rockaway Point at the northern end of Raritan Bay, is exposed to both open ocean swells and strong tidal currents (left image, from surveyed area). The interaction of tides, currents, and waves surrounding the shoal produce rolling breakers (right photo). Wave energy stirs up the sediment and suspends large volumes of sand in the water column. Wave energy fluctuates as the tide ebbs and flows, and sand is washed away and deposited elsewhere – in this case, it formed a mostly permanent sand bar off of Rockaway Point.
The shoal, located off Rockaway Point at the northern end of Raritan Bay, is exposed to both open ocean swells and strong tidal currents (left image, from surveyed area). The interaction of tides, currents, and waves surrounding the shoal produce rolling breakers (right photo). Wave energy stirs up the sediment and suspends large volumes of sand in the water column. Wave energy fluctuates as the tide ebbs and flows, and sand is washed away and deposited elsewhere – in this case, it formed a mostly permanent sandbar off of Rockaway Point.

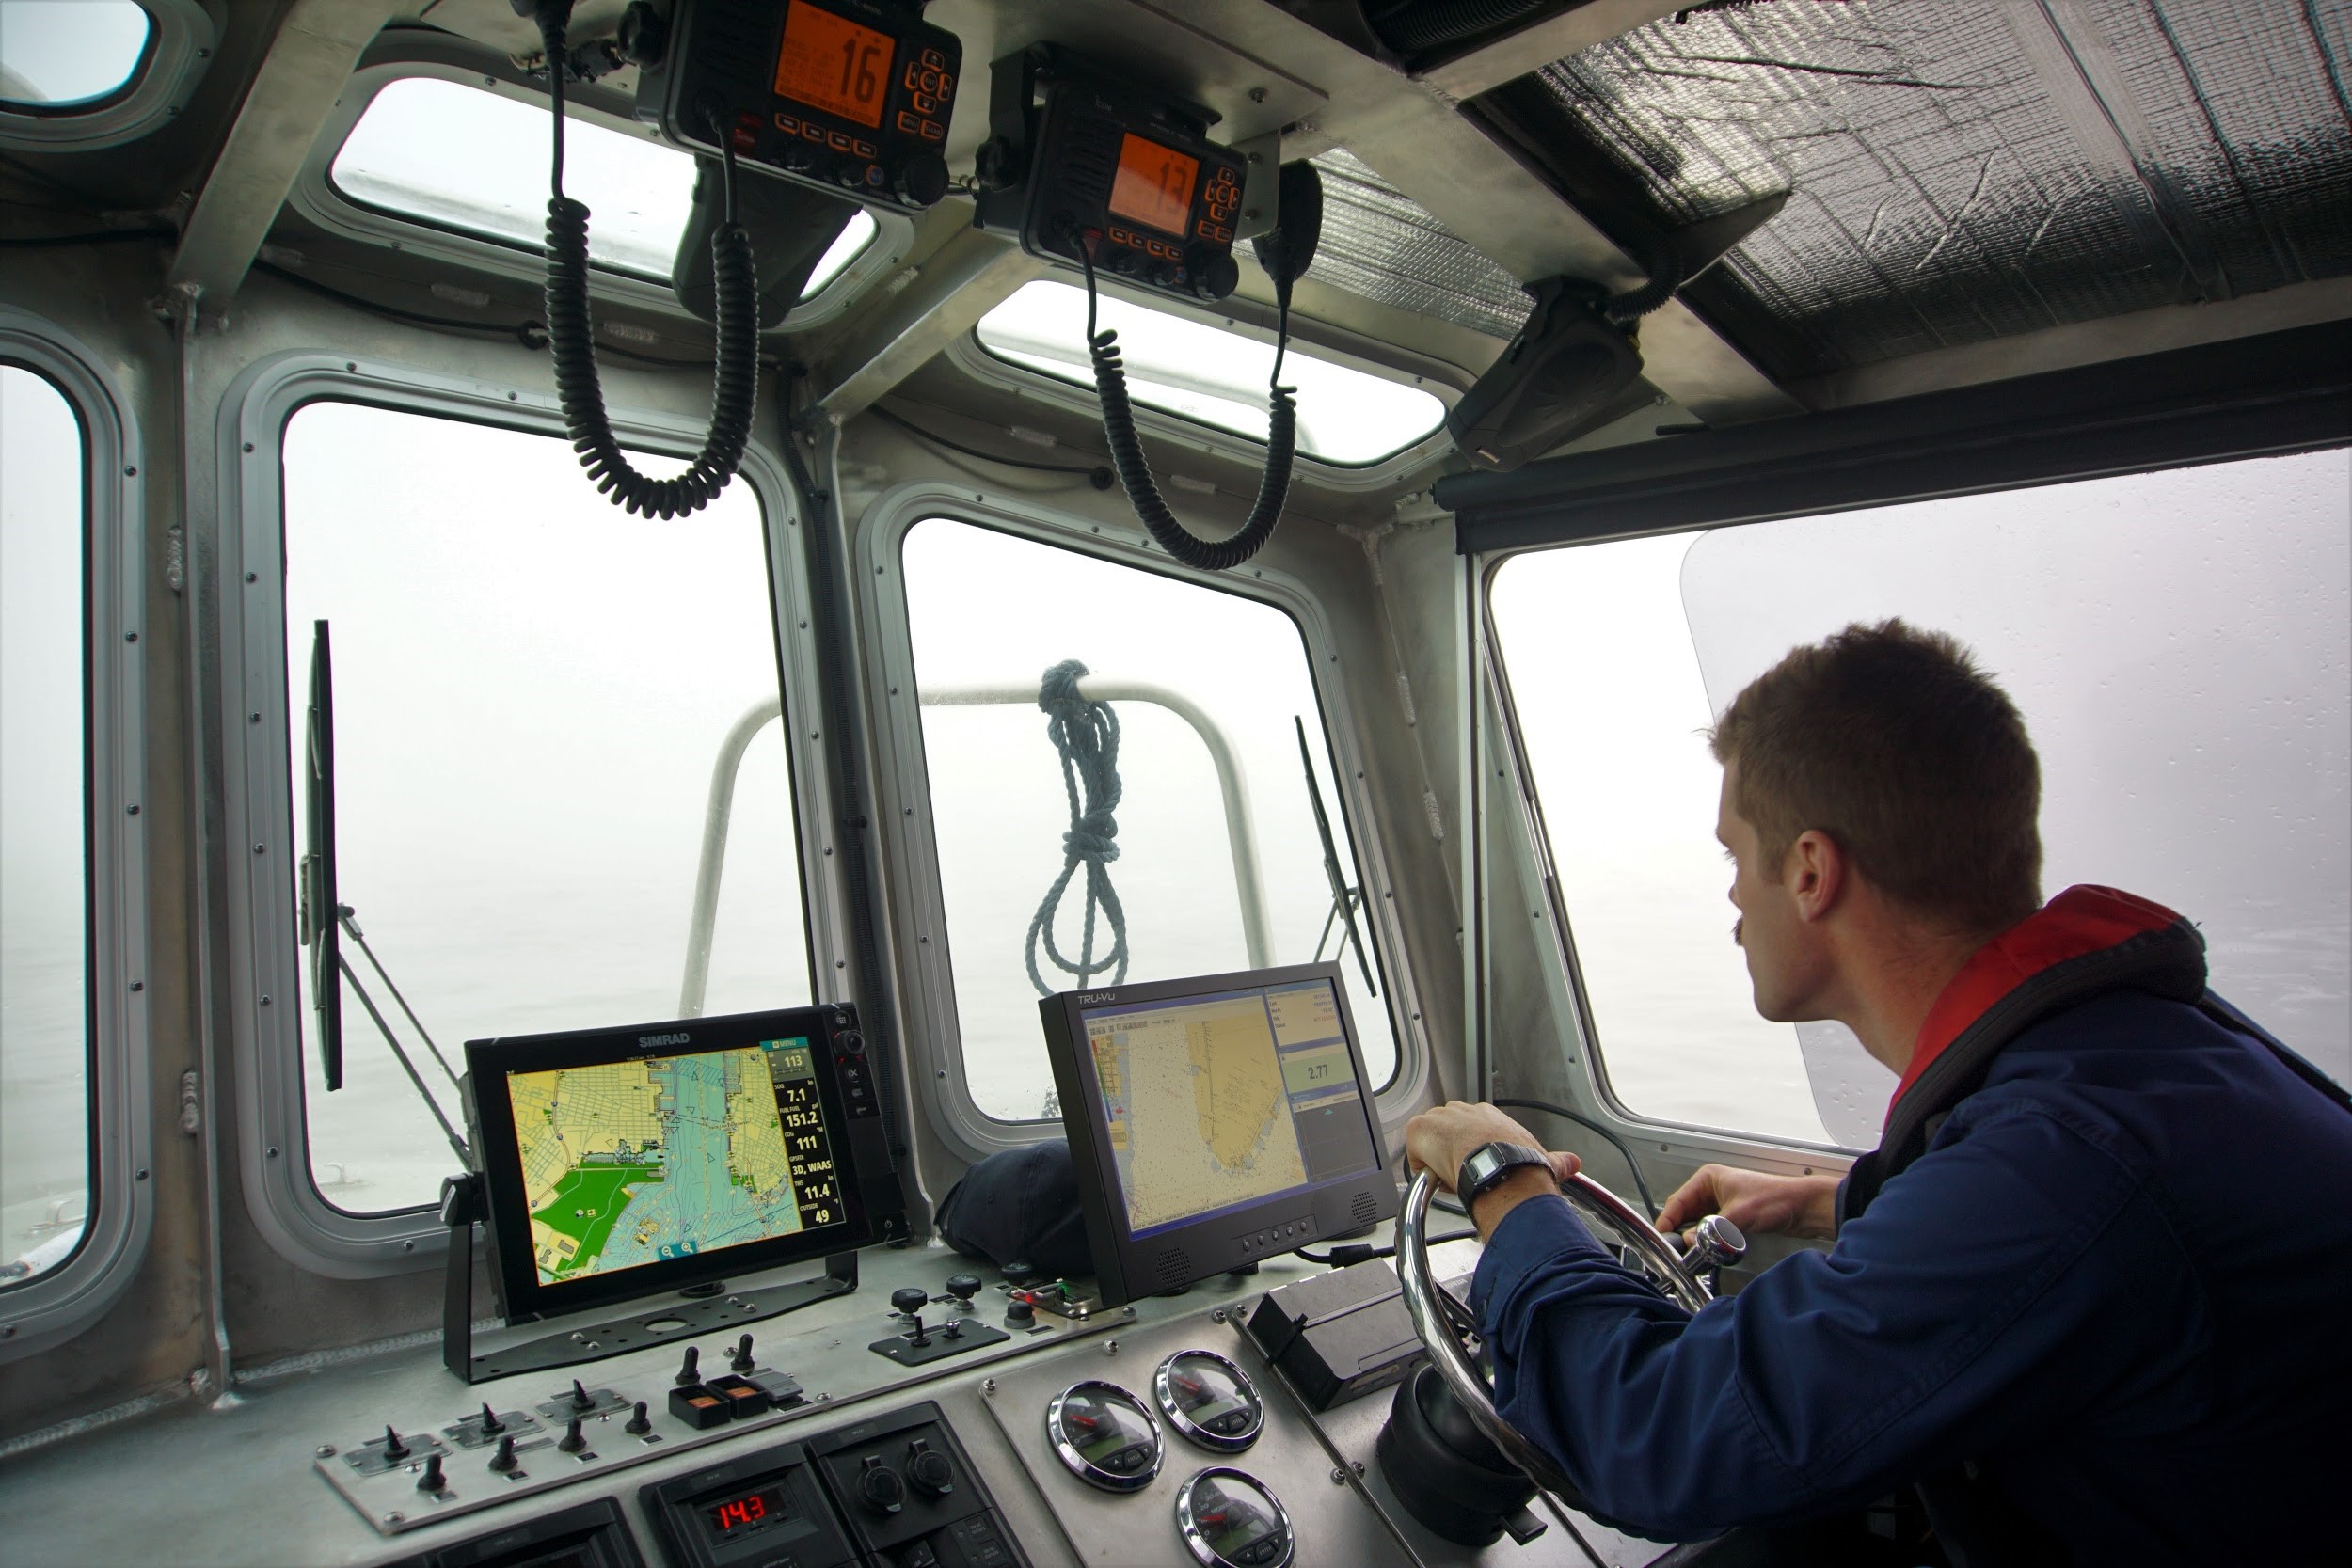
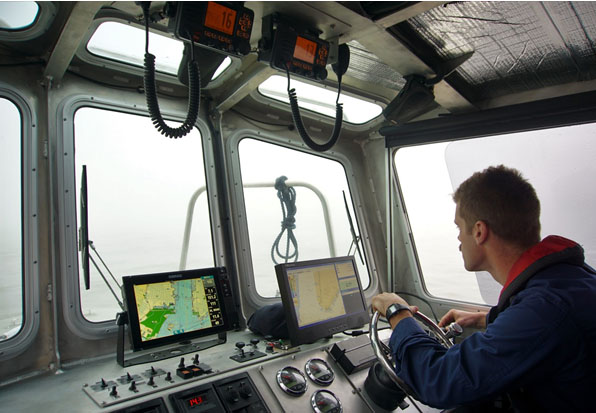
Conditions changed quickly. The northeast experienced unseasonably warm temperatures, and a thick blanket of fog engulfed New York Harbor as the warm air met the cold water of the ocean, harbors, and bays. With weather conditions thought to be better outside of the harbor and to likely improve later in the morning, the team cautiously transited to the project area and found conditions were indeed much more favorable.
Lt. j.g. Dylan Kosten keeping a steady watch through the thick fog.

Despite the challenges, NRT5 successfully completed the survey of the area by the end of the week. While the 6-foot contour was not reached in all areas due to breaking waves, the data was interpolated to that scale using lines of data run across the shoal in between wave sets. NRT5 has processed and analyzed the acquired data and Coast Survey will use it to create products to improve the resolution of the charted shoal and prevent future incidents.
During NRT5’s responses in areas surrounding the New York Harbor, the USCG Aids to Navigation Team (ANT) in Bayonne, New Jersey, offered the team a spot to dock their vessel at the end of the day. This sheltered station provided safety from poor weather conditions and allowed the team to quickly transit to project areas. Here, NOAA survey vessel S3007 is moored alongside at the USCG station.

Survey data coverage acquired around the sandbar. The black line marks the 12-foot depth contour and the red dashed line marks the interpolated 6-foot depth contour. The wreck symbols indicate where vessel groundings occurred in the weeks prior to this survey.

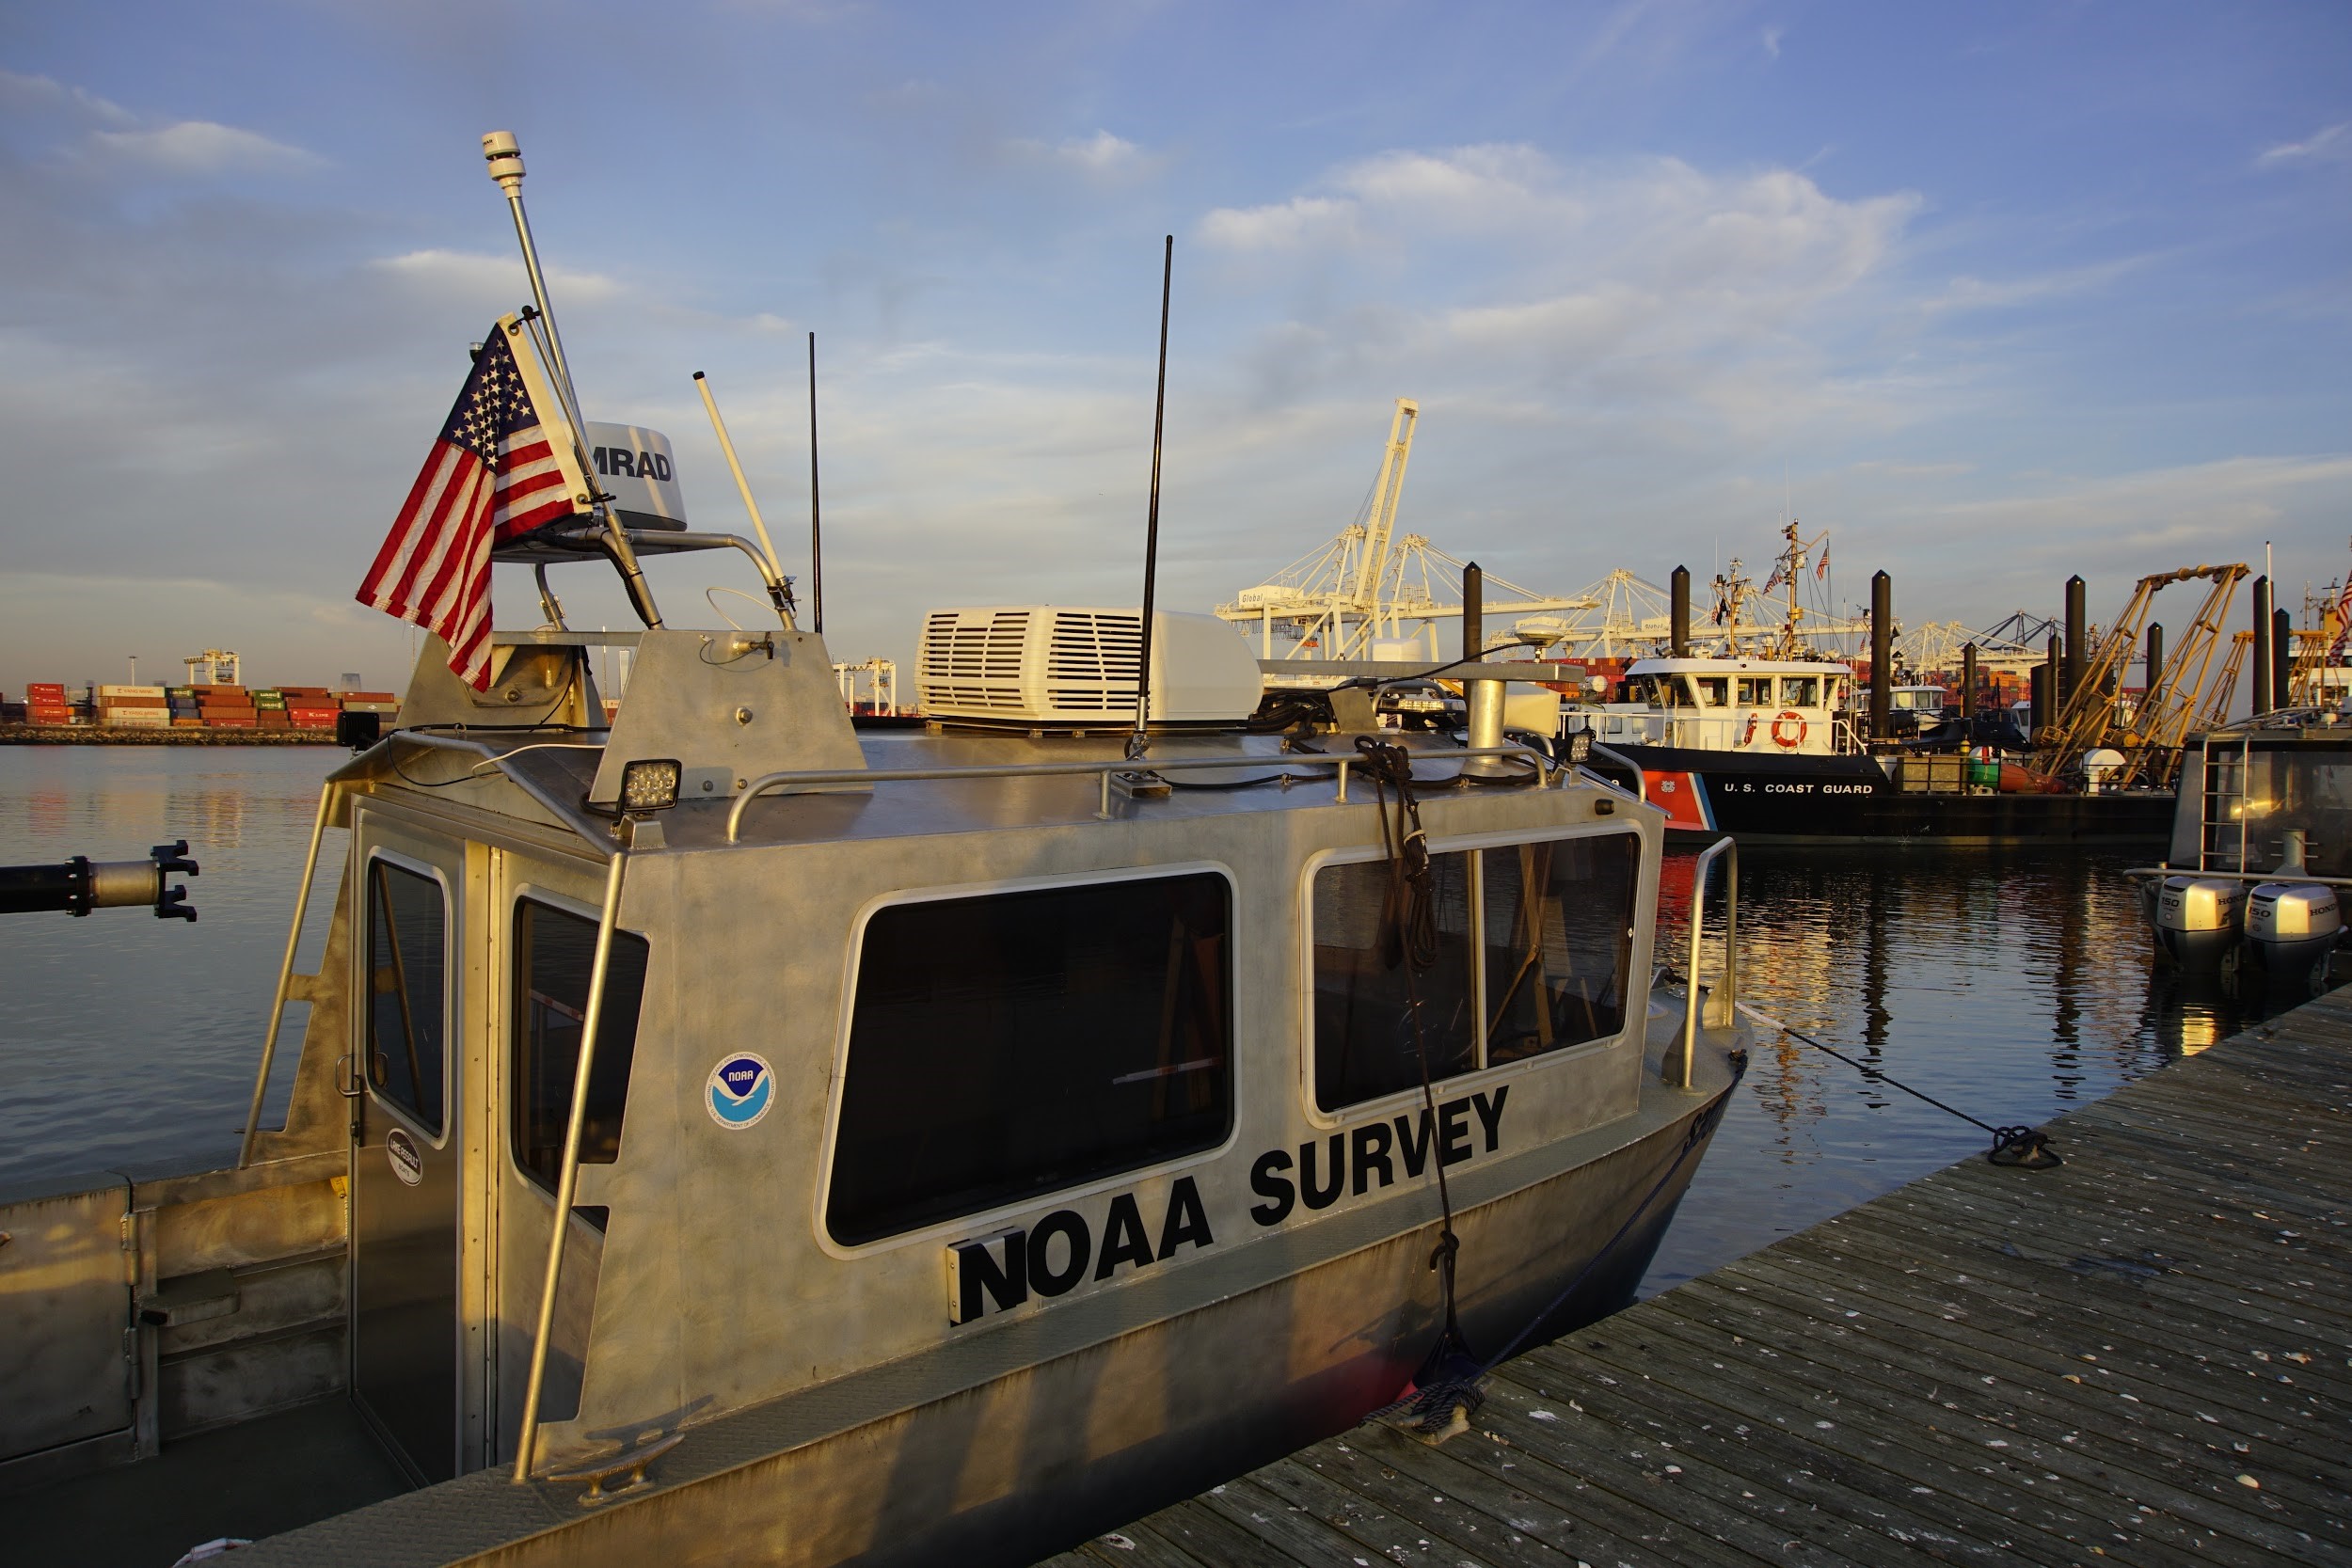
Coast Survey’s NRTs conduct hydrographic surveys to update NOAA’s suite of nautical charts. The teams are strategically located around the country and remain on call to respond to emergencies speeding the resumption of shipping after storms, and protecting life and property from underwater dangers to navigation. NRT5 team members contributed the content of this story.

2 Replies to “NOAA navigation response team investigates hazardous shoal off Rockaway Point, NY”

  1. I see it’s unusual currents that may have caused this shoal to appear, but I missed the point of what actually caused the shoal. I should prolly get more sleep before I read an article. Thank you for you time!😁

  2. I believe this is the shoal that the private fishing / pleasureboat DO THE BEARCAT sank on in |July 2019 .

Leave a Reply

Your email address will not be published. Required fields are marked *