The Port of New Orleans, is one of the largest ports in the United States. It spans both sides of the Mississippi River in the state of Louisiana, with its lower limit situated approximately 80 miles above the confluence of three major passes used to access the river from the Gulf of Mexico. The city of New Orleans serves as the primary commercial hub within the port’s limits. As one of the largest cities along the Gulf Coast, it is a natural gateway for trade, connecting the vast central and southern regions of the nation, particularly the entire Mississippi River Valley, via numerous inland water routes.
Continue reading “NOAA updates bridge clearances crossing one of the most important waterways in the United States”Bringing nautical charts of the Erie Canal into the digital era
The construction of the Erie Canal was one of 19th Century America’s most significant feats of engineering. Built between 1817 and 1825, the canal provided a water route from Albany to Buffalo, New York, nearly 363 miles to the west. The Canal connected the Hudson River with the Great Lakes via parts of the Mohawk River, through various land cuts and natural lakes. The New York State Public Works Department and the US War Department’s Corps of Engineers began geographically documenting the canal’s route with maps and nautical charts beginning in 1917. The Department of Commerce’s National Oceanic and Atmospheric Administration took ownership of the charts in the early 1970’s and has maintained and updated them for over 50 years. Currently, these charts are undergoing changes to usher them into the digital era of electronic navigational charts.
Check out our digitizing the Erie Canal ArcGIS StoryMap linked here or click the image below!

Vessel pilots transition to new chart format
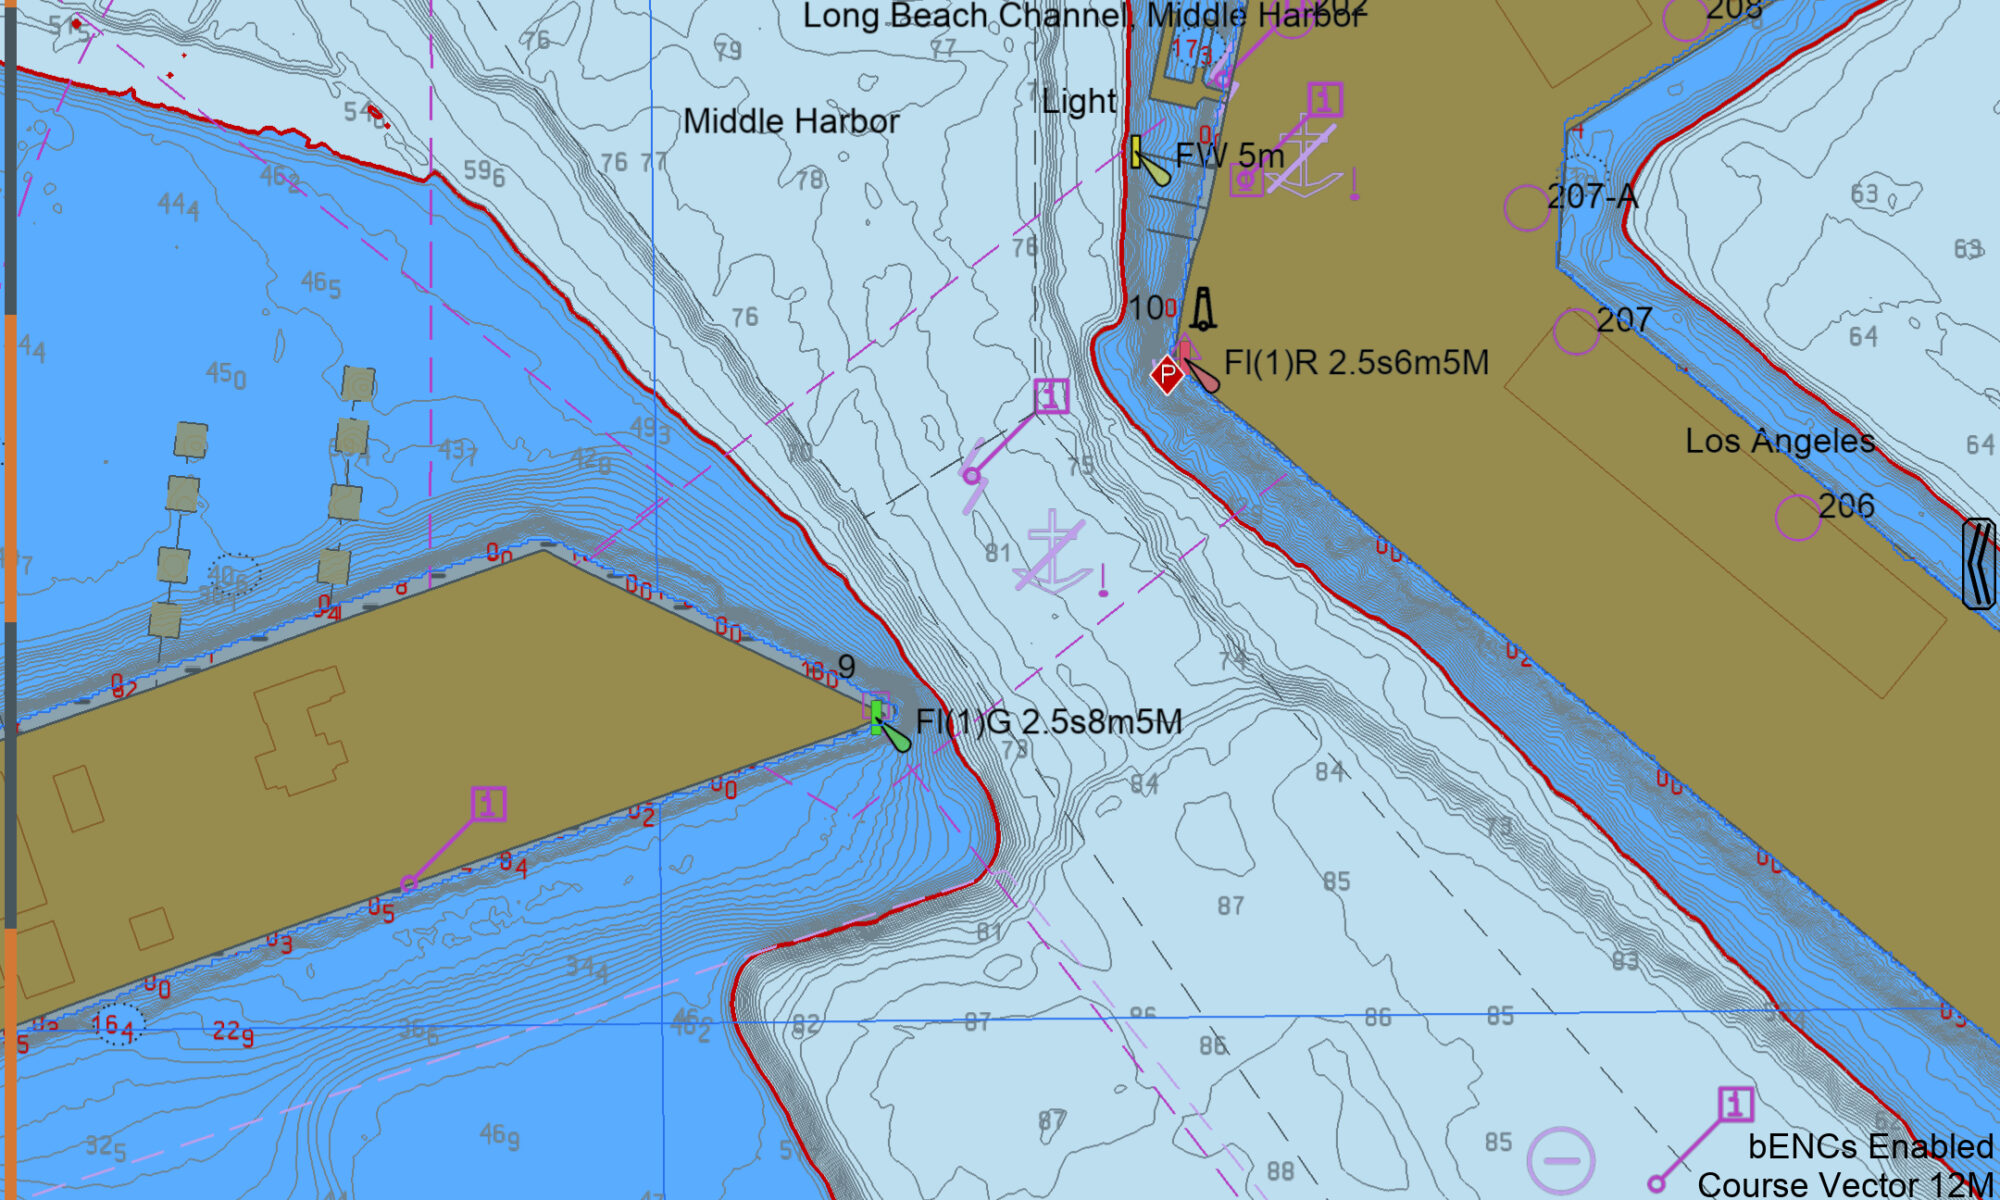
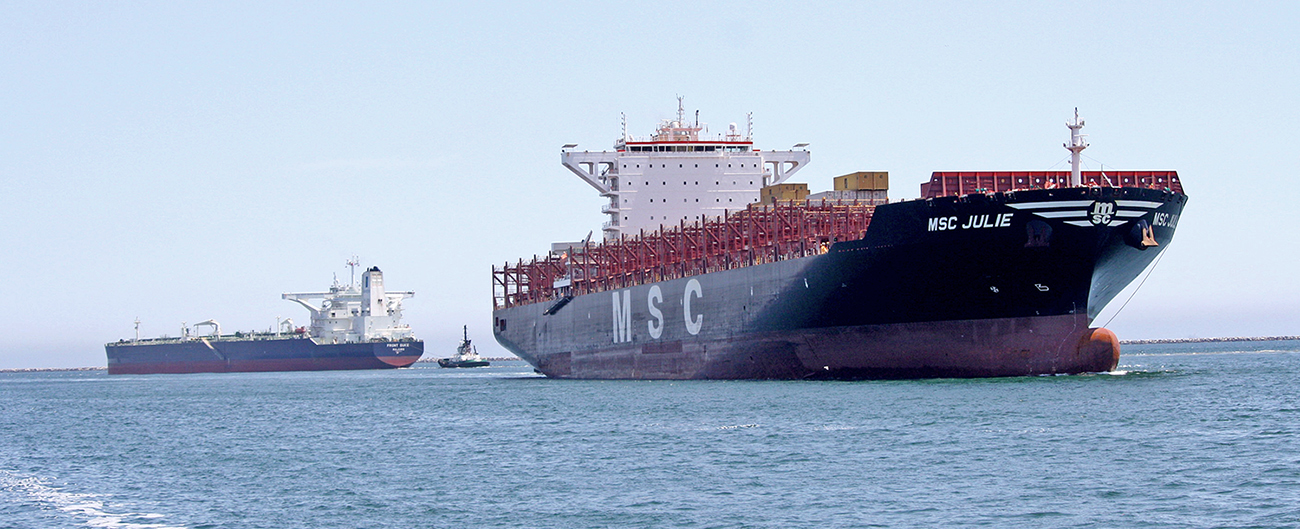
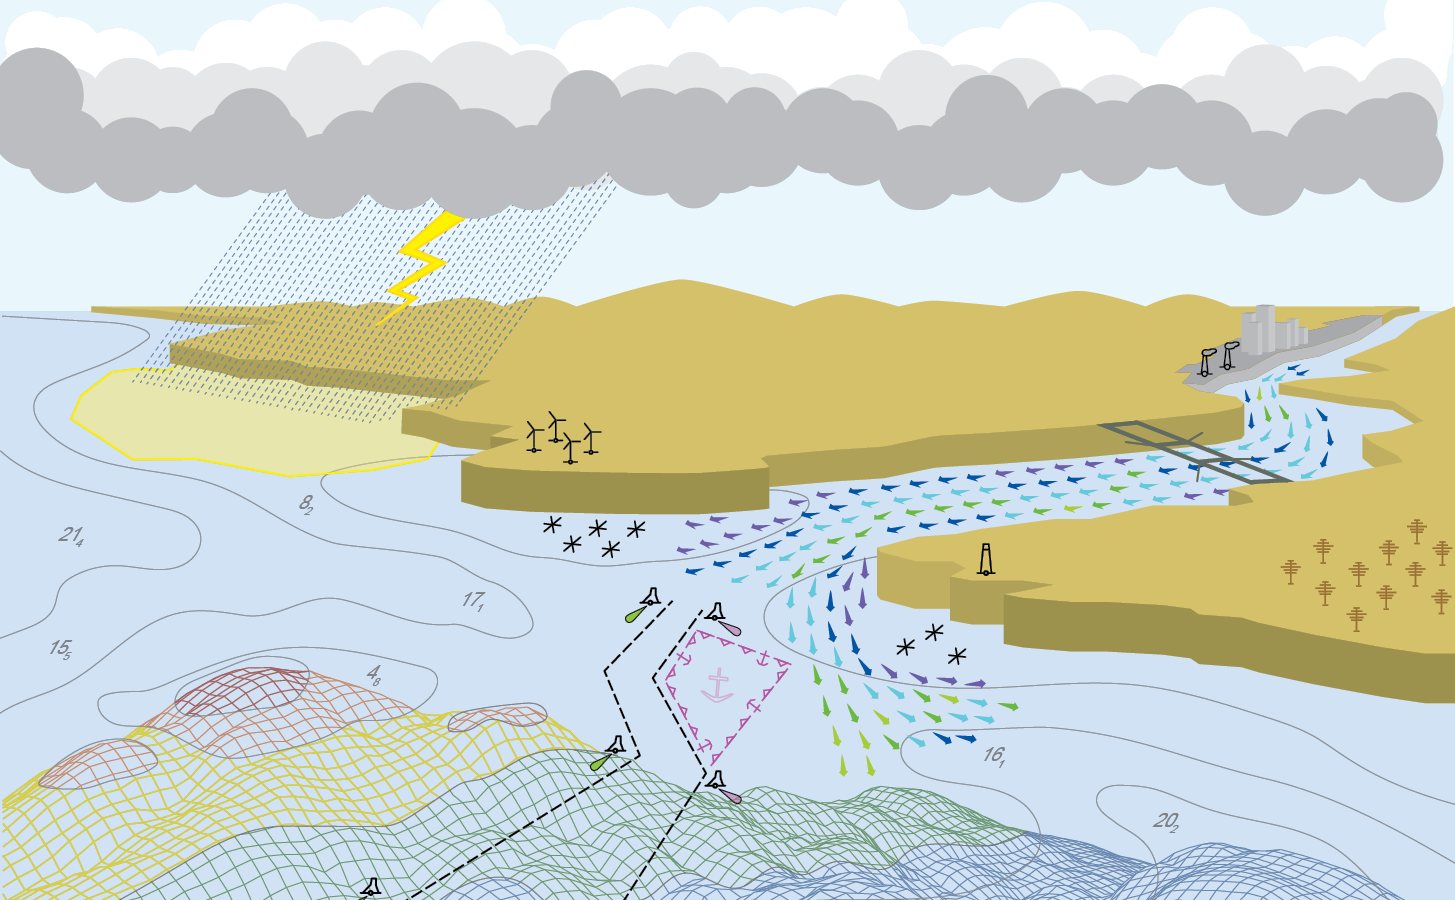
NOAA’s Precision Marine Navigation (PMN) program aims to seamlessly integrate high-resolution bathymetry and high accuracy positioning and shoreline data with the forecast data of water levels, currents, waves, and weather forecasts. This information can be easily accessed and integrated into maritime electronic charting systems and other decision support tools so mariners can plan their transits and make decisions while at sea and coming to and from port. A key component of this program is providing vessel pilots with detailed depth information to ensure safety of vessel transits and that critical under keel clearance safety margins are maintained. Electronic navigational charts, although accurate, typically do not provide the detail that pilots prefer.
Continue reading “Vessel pilots transition to new chart format”Coast Survey launches NOAA Chart Display Service
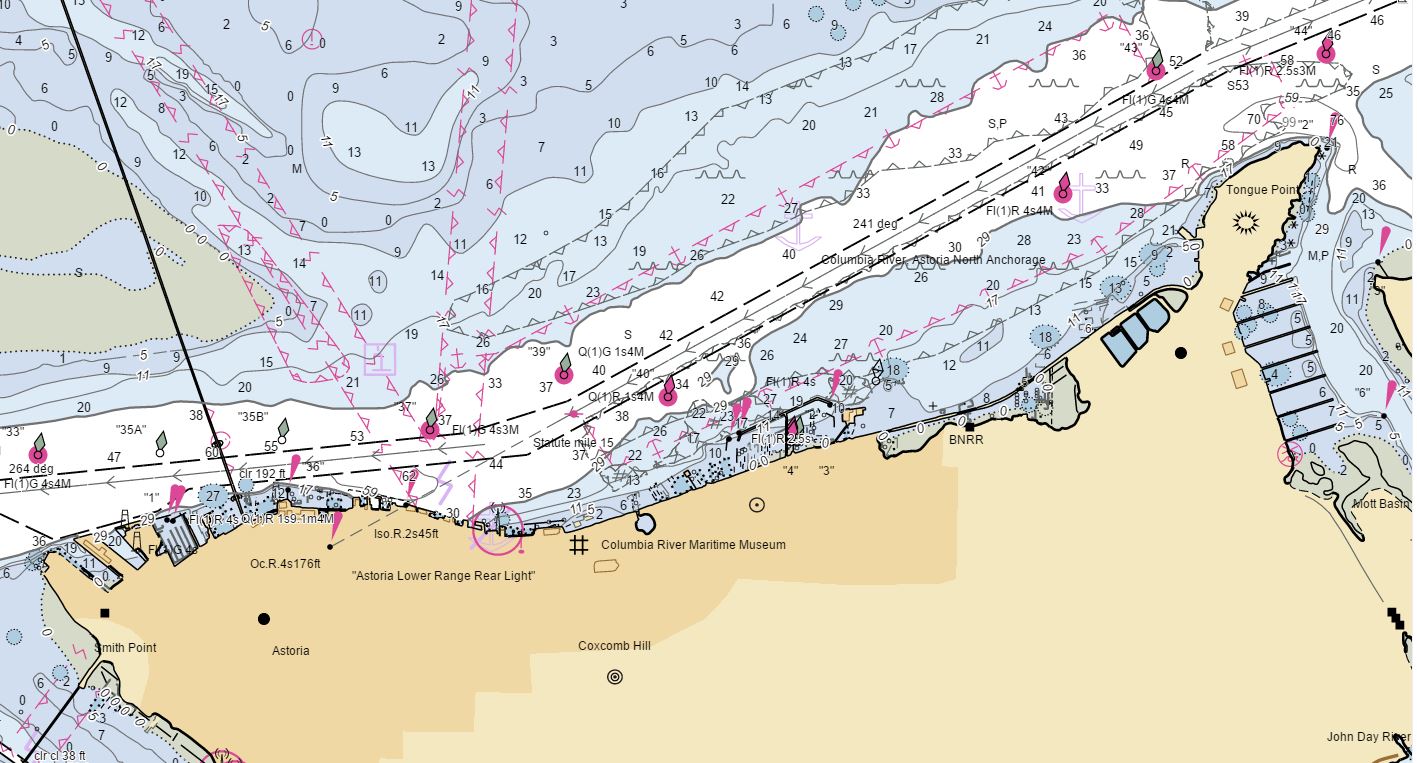
The new NOAA Chart Display Service (NCDS) renders NOAA electronic navigational chart (NOAA ENC®) data with “traditional paper chart” symbology in online and offline applications for which a basemap of nautical chart data is desired, including GIS, web-based, and mobile mapping applications. The new service uses symbols, labels, and color schemes familiar to those who have used NOAA paper nautical charts or the NOAA Custom Chart application. NCDS is available as Esri REST Map Service, OGC Web Map Service (WMS), and MBTiles formats.
Continue reading “Coast Survey launches NOAA Chart Display Service”
The nautical chart update process – build it and we will chart it
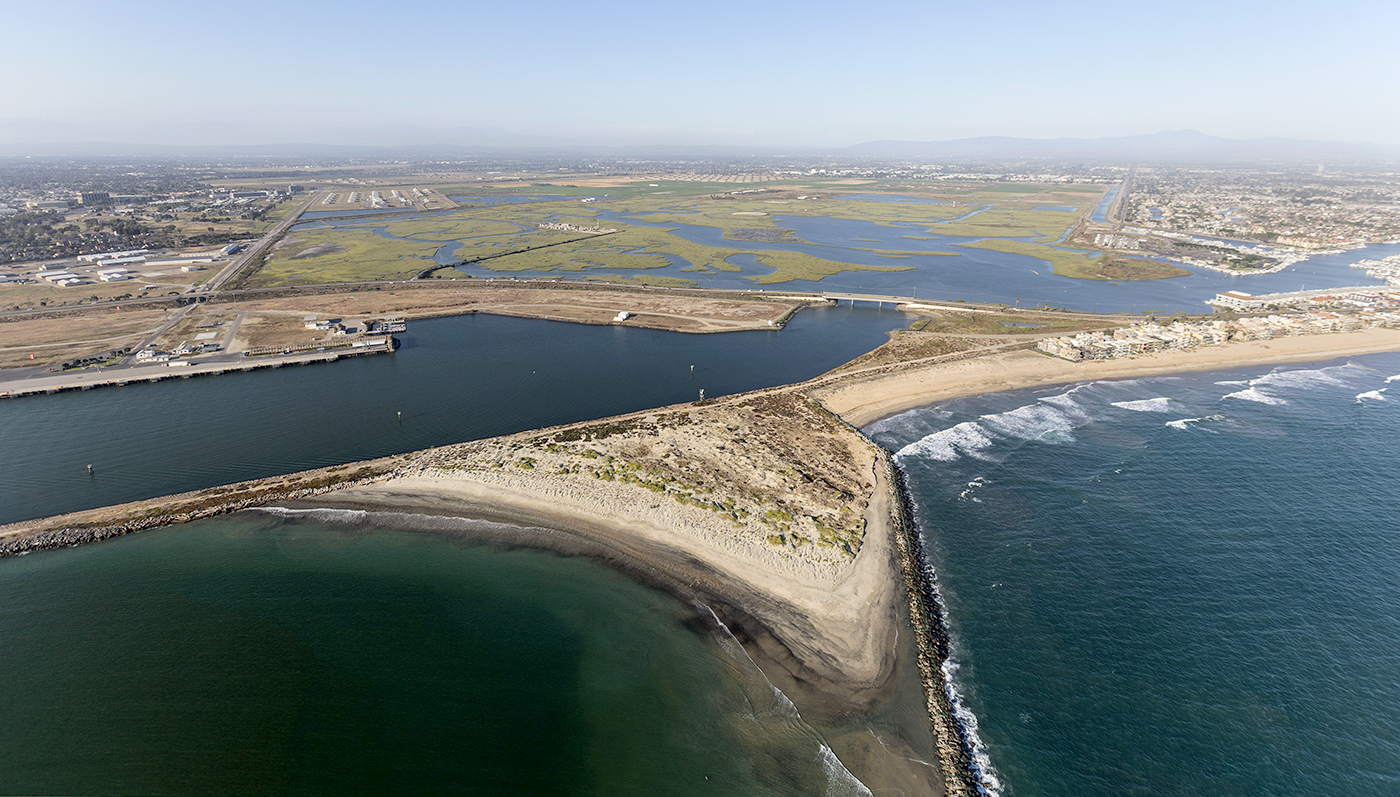
Nautical charts are updated with the most current information available through several processes and workflows within NOAA’s Office of Coast Survey. The large majority of these updates consist of revisions to water depth information. The bottom of a water body is changeable by nature, thus hydrographic surveys are constantly necessary to show contemporary depths in a given body of water. What doesn’t happen quite as often are changes to land along the coast, altering the way inlets, harbor entrances, and river mouths appear from a bird’s eye view. Unless there has been a catastrophic event, these changes in land are usually the result of human interaction.
Continue reading “The nautical chart update process – build it and we will chart it”New NOAA website provides marine navigation resources in a central location
A recently launched website from NOAA’s Precision Marine Navigation (PMN) program will improve the use and accessibility of NOAA’s marine navigation products and services. The website, Marine Navigation, includes links and short descriptions to NOAA’s various navigation resources, providing a one-stop shop that mariners can visit to get the data they need. Designed for shipping professionals and recreational boaters alike, the PMN program hopes the website will become a valuable tool to support all mariners in their navigation planning and decision making processes.
Continue reading “New NOAA website provides marine navigation resources in a central location”NOAA’s Precision Marine Navigation data service receives first major update
The Precision Marine Navigation (PMN) program has completed the first update of its prototype navigation data service – the PMN data processing and dissemination system and PMN Data Gateway viewer. The data processing and dissemination system provides surface current forecast guidance from NOAA’s forecast systems, in a prototype marine navigation data format. The viewer allows users to visualize the predictions and discover where they are. Both the system and the viewer were updated to include data from the recently upgraded Northern Gulf of Mexico Operational Forecast System (NGOFS2).
Continue reading “NOAA’s Precision Marine Navigation data service receives first major update”NOAA Custom Chart version 1.0 released to the public
On April 1, 2021, NOAA’s Office of Coast Survey released NOAA Custom Chart version 1.0, a dynamic map tool which enables users to create their own paper and PDF nautical charts derived from the official NOAA electronic navigational chart (NOAA ENC®), NOAA’s premier nautical chart product.
Continue reading “NOAA Custom Chart version 1.0 released to the public”Nautical charts reflect alternate route along Gulf Intracoastal Waterway
In anticipation of the temporary closure of the Gulf Intracoastal Waterway (GIWW)’s Inner Harbor Canal Lock, the Office of Coast Survey released three updated NOAA electronic navigational charts (NOAA ENC®) reflecting the Chandeleur Sound Alternate Route and the addition of 97 Aids to Navigation (ATON). The updated charts include US5LA24M, US4LA34M, and US4MS12M and can be viewed in NOAA’s ENC Viewer or downloaded from NOAA’s Chart Locator.
Continue reading “Nautical charts reflect alternate route along Gulf Intracoastal Waterway”NOAA awards cooperative agreement to UNH/NOAA Joint Hydrographic Center
NOAA’s Office of Coast Survey awarded a 5-year cooperative agreement to the University of New Hampshire for the continuation of the Joint Hydrographic Center. The Joint Hydrographic Center is a NOAA/University research and education partnership aimed at maintaining a world-leading center of excellence in hydrography and ocean mapping. The new award, which will begin in January 2021, will build on the work of the Center since its founding in 1999.
Continue reading “NOAA awards cooperative agreement to UNH/NOAA Joint Hydrographic Center”


