In May of 2020, local geologists identified a steep, unstable slope that has the potential to become a tsunami-generating landslide in Barry Arm, a glacial fjord 60 miles east of Anchorage, Alaska. With documented cases of tsunami-generating landslides in Alaska including Lituya Bay in 1958 and Taan Fjord in 2015, this new hazard immediately caught the attention of state and federal partners who quickly joined forces to quantify the risk to those living and boating in Alaska’s Prince William Sound, specifically the communities of Whittier, Valdez, Cordova, Tatitlek, and Chenega.
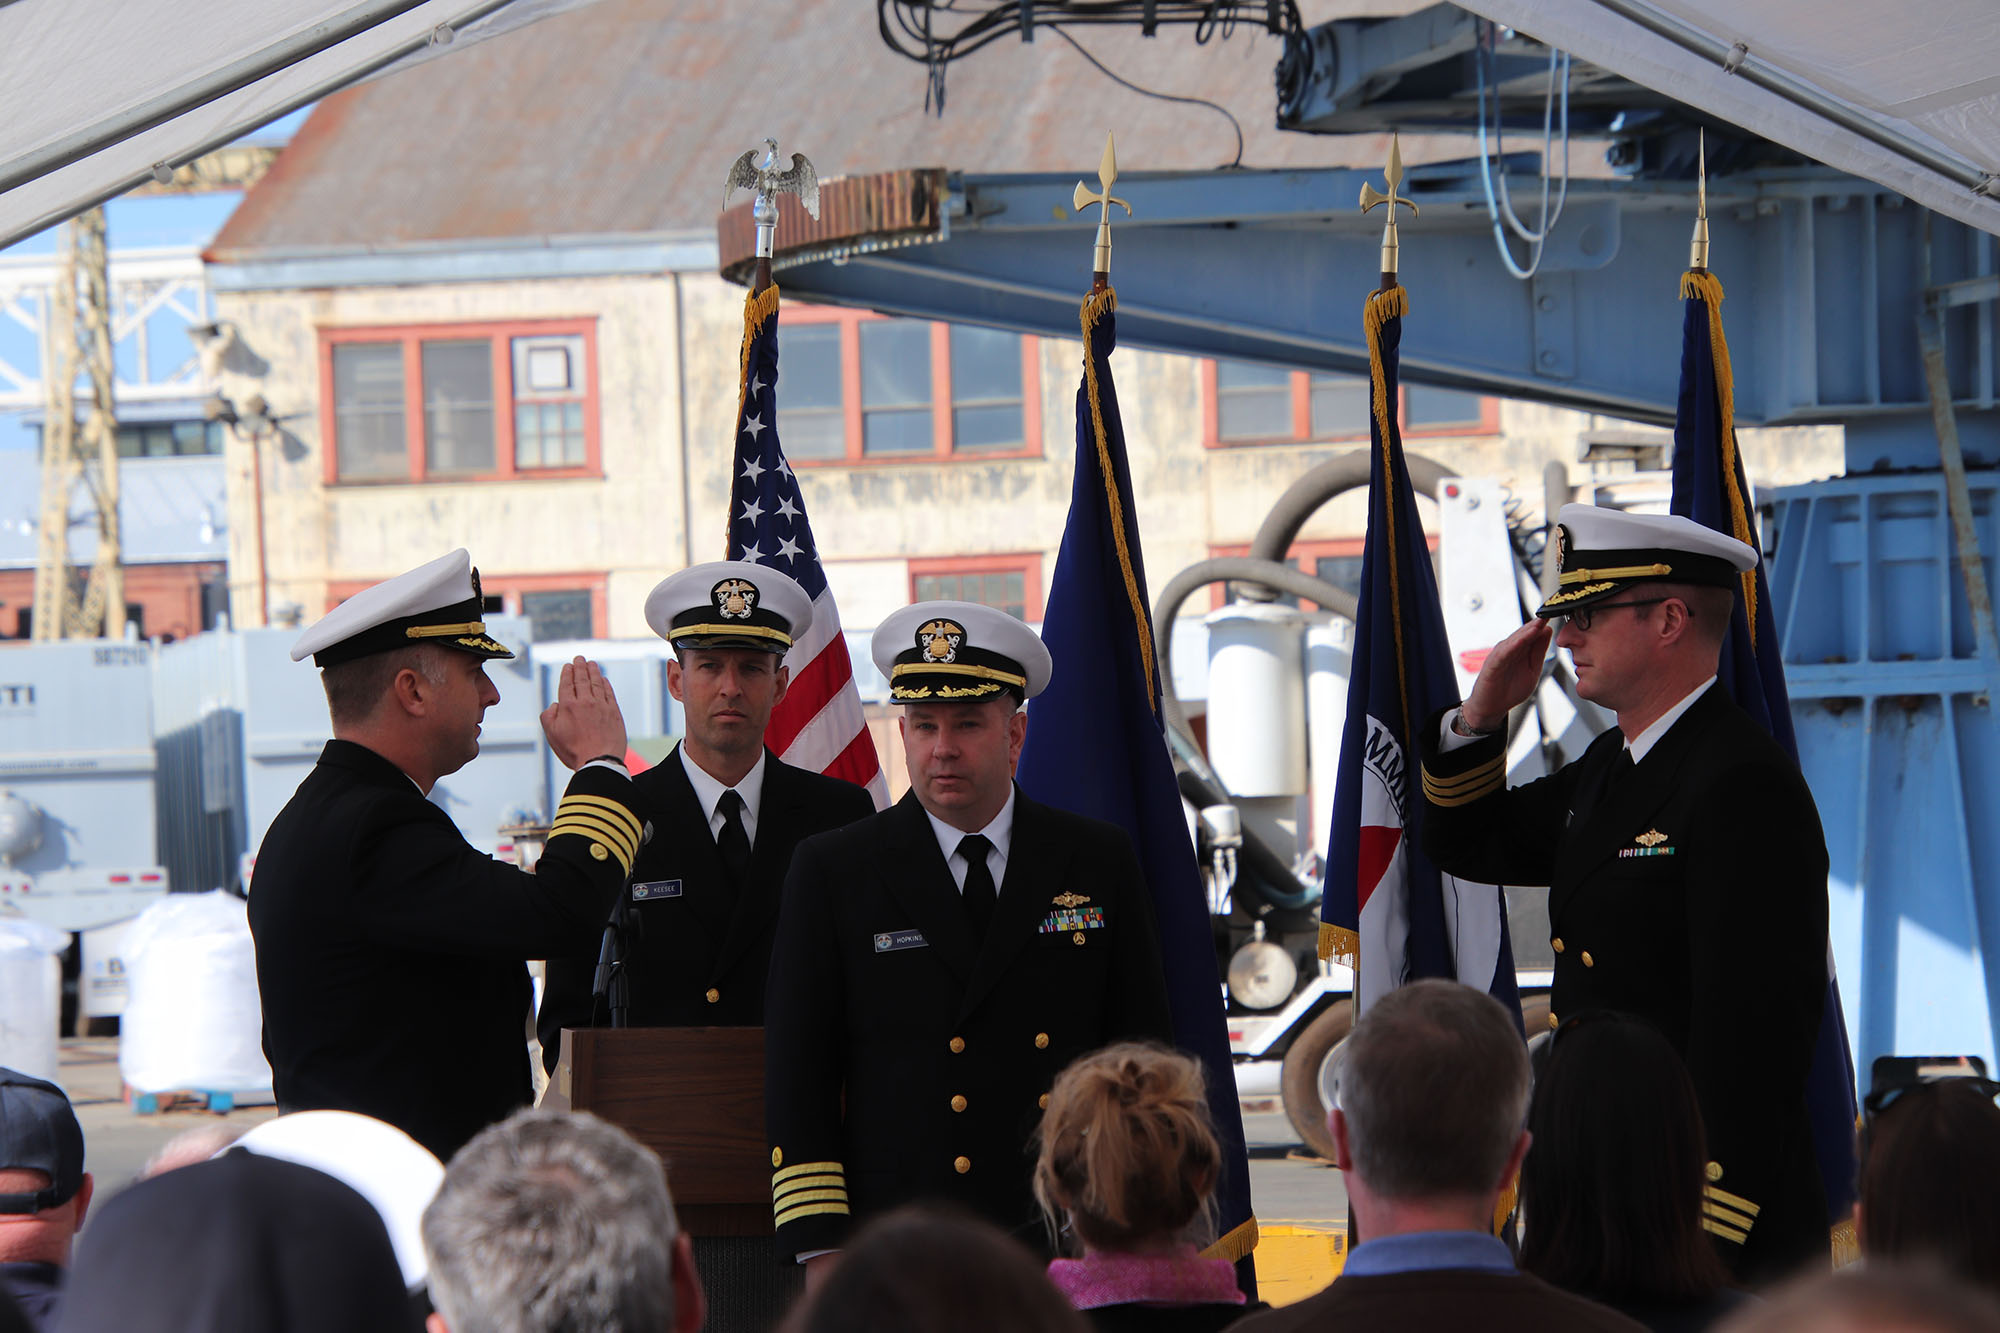
On November 15, 2019, the crew of NOAA Ship Rainier hosted a change of command in Valejo, California. Cmdr. Sam Greenaway accepted command of Rainier, relieving Capt. Ben Evans in a ceremony led by Capt. Michael Hopkins, commanding officer of NOAA’s Office of Marine and Aviation Operations (OMAO) Marine Operations Center-Pacific.
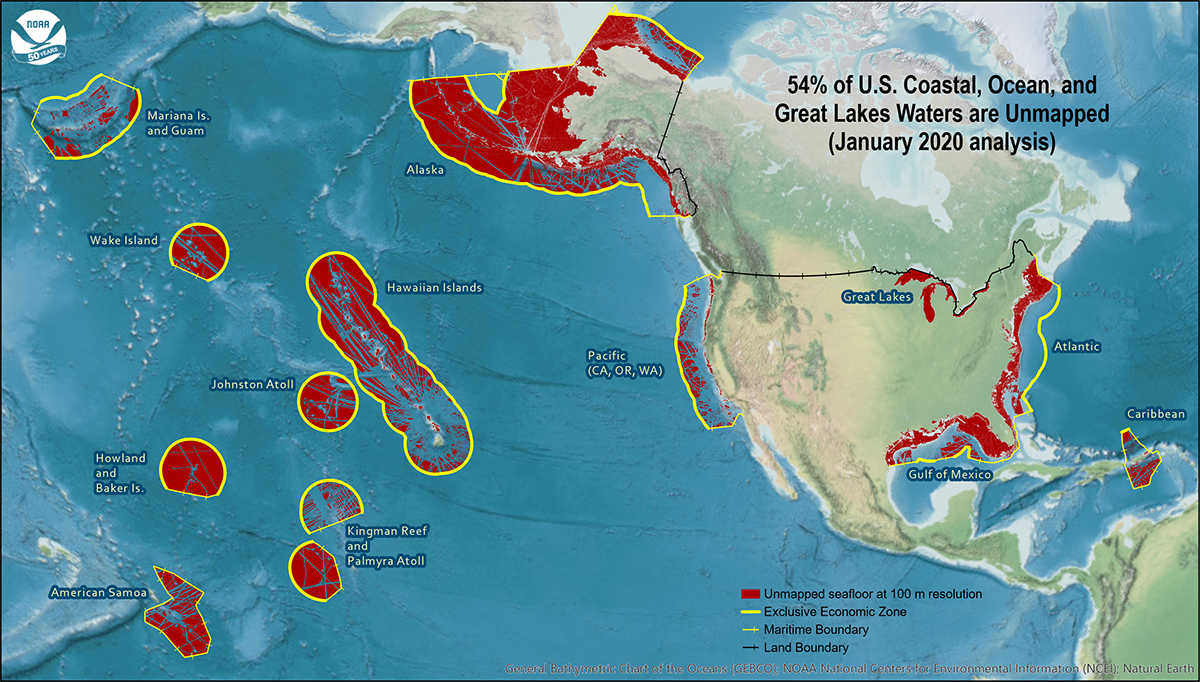
NOAA’s Office of Coast Survey is the nation’s nautical chartmaker, and maintains a suite of more than a thousand nautical charts. Coast Survey is responsible for charting U.S. waters and Great Lakes covering 3.4 million square nautical miles (SNM) of water and 95,000 miles of coastline.
NOAA’s hydrographic survey ships along with hydrographic contractor vessels,recently kicked off the 2019 hydrographic survey season. These surveys not only update the suite of nautical charts, but also help to maintain the safety of maritime commerce, recreational boaters, natural ecosystems, and much more. Operations are scheduled for maritime priority areas around the country and are outlined in Coast Survey’s “living” story map. Here is a list of where they are headed this year:
By Lt. Cmdr. Adam Reed, Integrated Oceans and Coastal Mapping (IOCM) assistant coordinator
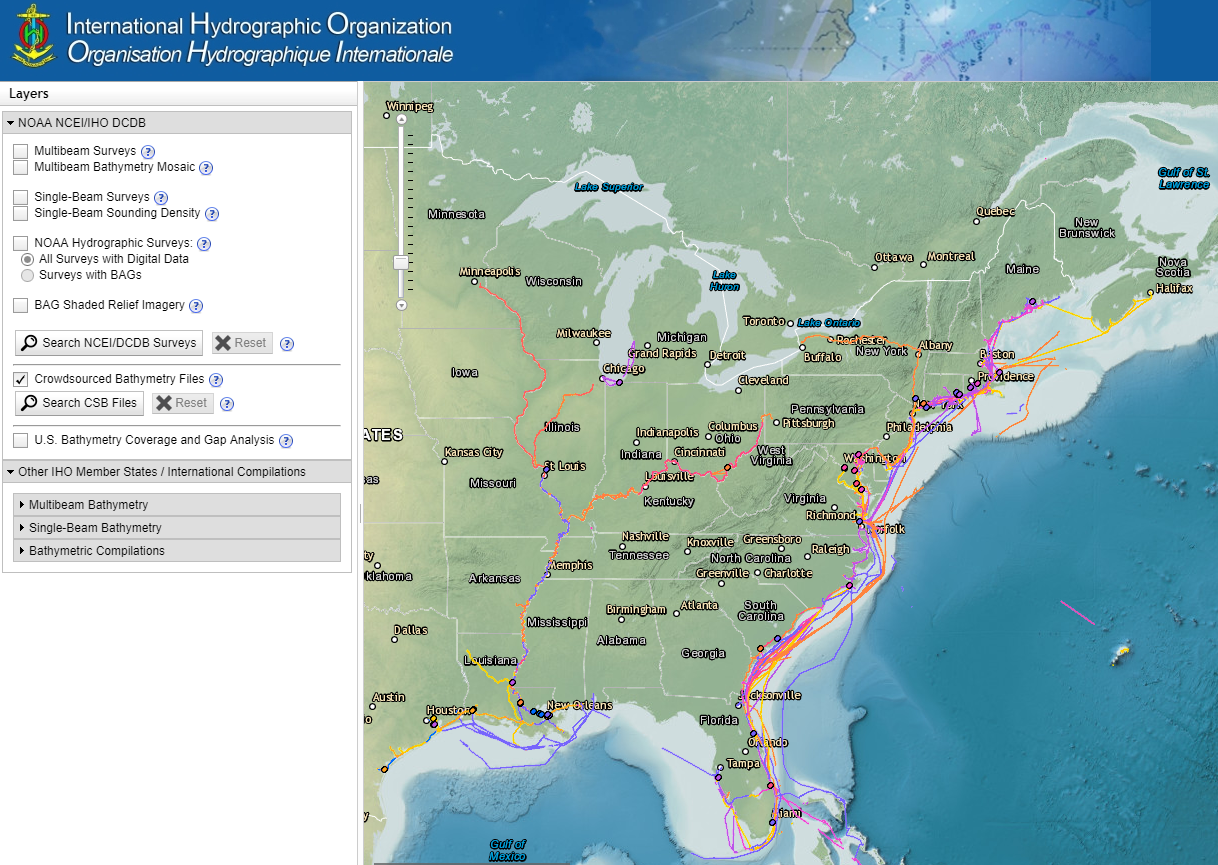
Today NOAA announces the end of a testing phase in the development of a new crowdsourced bathymetry database. Bathymetric observations and measurements from participants in citizen science and crowdsourced programs are now archived and made available to the public through the International Hydrographic Organization (IHO) Data Centre for Digital Bathymetry (DCDB) Data Viewer. The operationalized database allows free access to millions of ocean depth data points, and serves as a powerful source of information to improve navigational products. Continue reading “NOAA announces launch of crowdsourced bathymetry database”
In 2005, the International Hydrographic Organization established World Hydrography Day, celebrated annually on June 21. To observe this year’s World Hydrography Day, NOAA’s Office of Coast Survey is calling for articles for an e-publication dedicated to this year’s theme: “Hydrography: It’s More Than Charts.” Hydrography is the science upon which nautical charting is based, but, as this year’s World Hydrography Day theme conveys, researchers and planners use hydrography in a range of activities that benefit the coastal environment and the marine economy. A NOAA survey ship uses its multibeam echo sounder to conduct hydrographic surveys Continue reading “Call for articles! Hydrography: it’s more than charts”
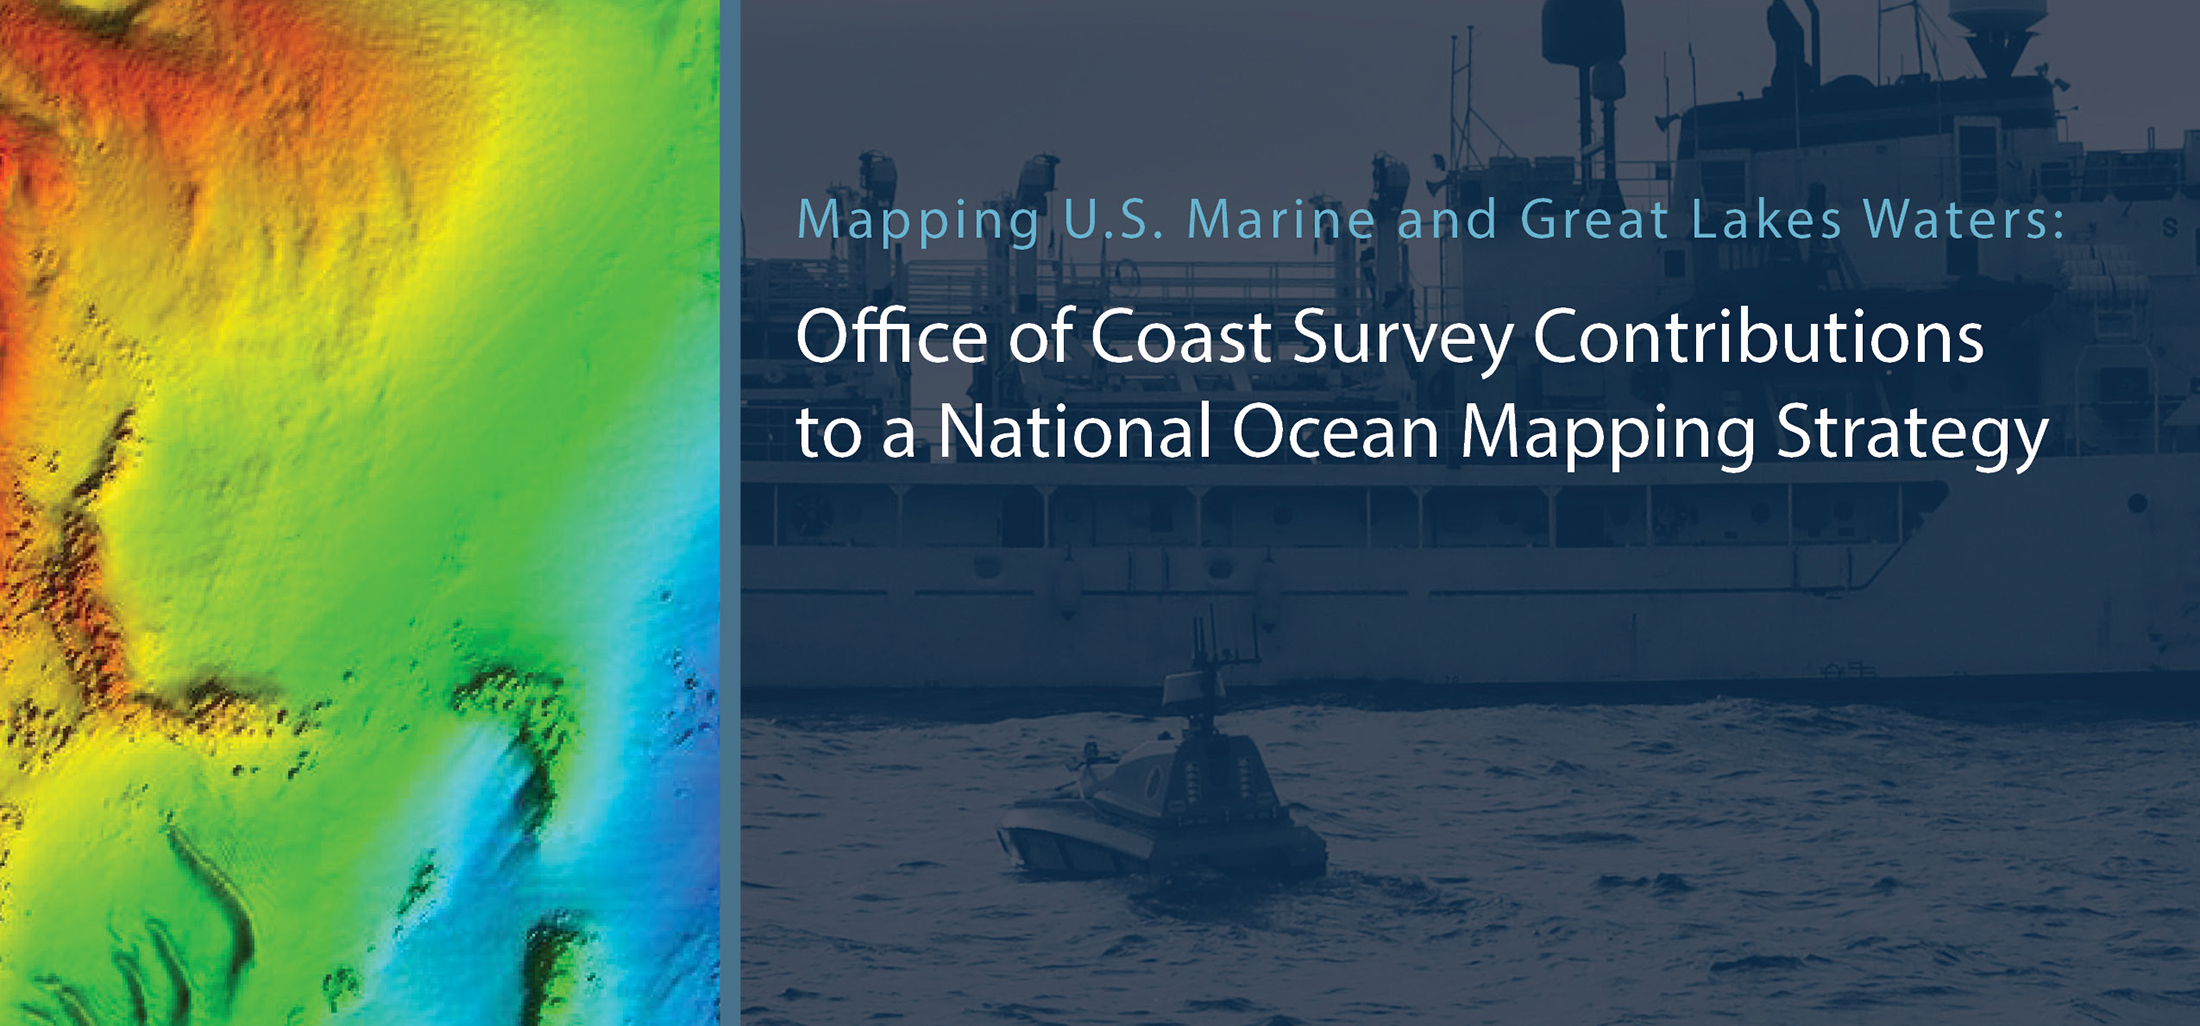
By Ashley Chappell, Integrated Ocean and Coastal Mapping coordinator
With 3.4 million square nautical miles of U.S. waters to survey and chart, Coast Survey is up against some big challenges in keeping nautical charts current. A complete survey of those waters would require over 500 ship years and $5 billion ‒ just to acquire the data. It is no wonder that we put substantial effort into a program known as integrated ocean and coastal mapping (IOCM), where trusted partners can provide high quality, standards-compliant hydrographic survey data for a multitude of uses, including chart creation.
One of our biggest challenges is in the Arctic. Whether you knew it or not, the U.S. is an Arctic nation thanks to Alaska, and this formerly frozen region is becoming more accessible to ship traffic as sea ice melts. But much of our Arctic coastal areas have never had full bottom bathymetric surveys, and some haven’t had more than superficial depth measurements since Captain Cook explored the northern regions in the late 1700s.
So NOAA has a dilemma: how do we survey and chart an ice-diminished Arctic when we have limited resources and limited seasonal access? We assessed data age and quality, we reviewed our chart coverage, and we developed the Arctic Nautical Charting Plan for where we would improve chart coverage if we get new data. But our resources for ship and contract surveys can only do so much, and we need more data… Hydrographic survey monitors were installed on the U.S. Coast Guard cutter Spar. Continue reading “NOAA and Coast Guard work together to get more surveying done in the Arctic”