
By Natalie Cook
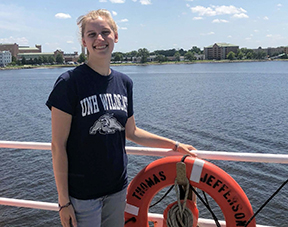
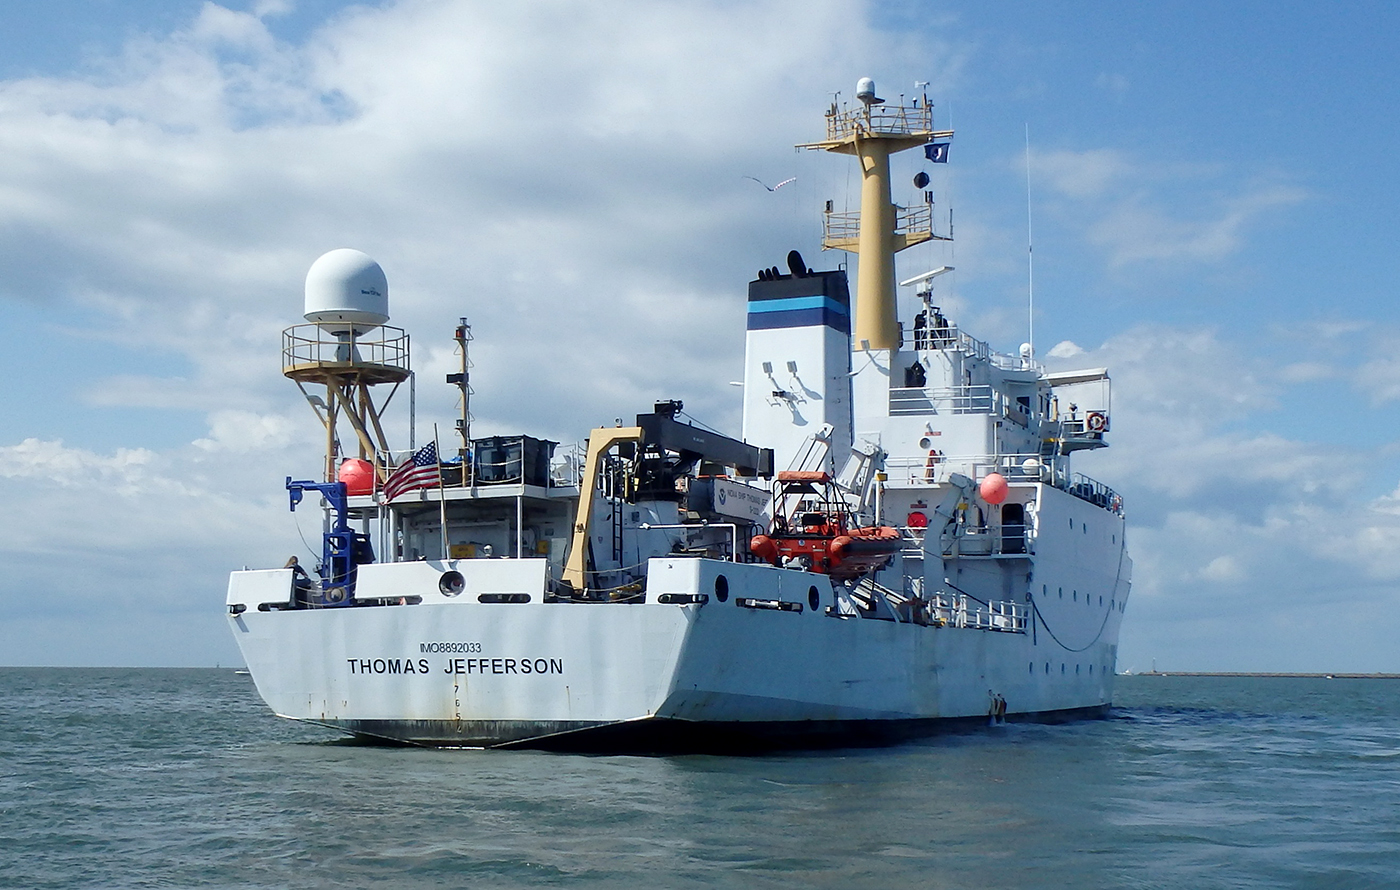
University of New Hampshire’s Center for Coastal and Ocean Mapping and NOAA are giving undergraduate students the opportunity to participate in seafloor mapping and associated exercises aboard a survey vessel this summer. Natalie Cook, a junior in the Ocean Engineering program, is spending eight weeks aboard NOAA Ship Thomas Jefferson, a 208-foot hydrographic survey vessel, experiencing all aspects of hydrography. Natalie is standing survey watch, processing data, working on survey launches, and serving as an active member of the hydrographic survey team.
Week one (June 14 to 20)
It’s only been one week so far on the NOAA Ship Thomas Jefferson but I’ve already learned so much about the technology, procedures, and people behind the hydrography. The Thomas Jefferson acquires depth data through the use of multibeam echo sounders and side scan sonar, fitted to 28-foot survey launches on the ship. This data is then converted into three-dimensional images that can display varying levels of depth and can also identify potential underwater hazards in the area.
My first day primarily consisted of tours and introductions to both people and technology. I had a tour of the ship’s multiple levels, decks, and where some of the systems and sonar receivers are housed. The room that I have been spending most of my time in is the survey control center, also known as the plot room. Inside the plot room is where the survey technicians plan out the courses for the ship and survey launches. Part of their jobs include collecting and processing the data that is received. The next day involved line handling training for the two 28-foot launches. The training included personnel on deck to manage the frapping lines, painter line, and both bow and stern lines, as well as the crew members of the boat hooking or releasing those lines.
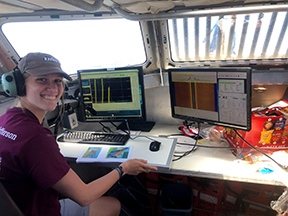
I’ve begun to accompany some of the hydrographers in charge and coxswains aboard the survey launches. We simply follow the lines planned out for us by the survey techs. The planned lines cover the targeted section and ensure that our side scan and multibeam cover the entire area as efficiently as possible, without wasting time and fuel. I learned about the different software used to collect and display the data, which included how to start and stop the logging and how to select a new line for our coxswain to follow. This collected data is eventually processed in the plot room and each line is inspected for unusual colorations or shadows, indicating objects that could potentially be a threat to safe navigation. If a contact is measured greater than one meter in length, it’s flagged and later investigated through both side scan and multibeam sonar to potentially identify it as a hazard in the area.
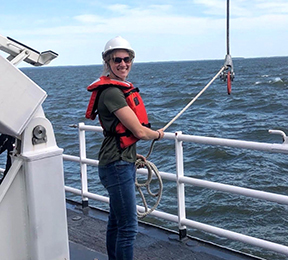
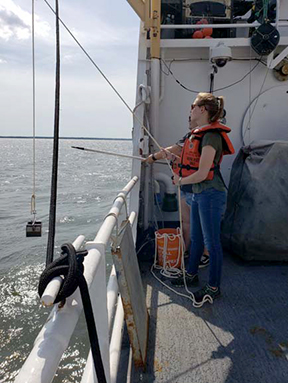
I have had the opportunity to participate in conductivity, temperature, and depth (CTD) casts aboard the launch. The cast involves stopping the launch and lowering the CTD cage underneath the surface of the water for two minutes. The cage is then lowered to touch the bottom before immediately being brought back up and the data collected by the hydrographer in charge. This data is collected every few hours and is used to determine the exact conditions in which the sonar travels. Since the speed of sound increases with salinity, temperature, and depth, knowing the ocean conditions in which the multibeam and side scan sound waves travel is crucial. This ensures that the hydrographic data is taken with a speed of sound adjusted by the CTD measurements.

I’ve also had the chance to work with the engineers on board. The chief engineer gave me a tour of the ship’s engine, the davits used to lower the survey launches into the water, and the various systems aboard, such as the one that converts seawater to drinkable water through reverse osmosis. The main role of the engineers on board is to keep the ship, launches, equipment, and systems all running while also working to improve them. This can include anything from engine repair to welding on new pieces of railing to ensure the ship’s deck is safer.

On the starboard aft of the ship there was a gap between the railing and an emergency escape hatch that was large enough for someone to slip and fall through. To create a makeshift railing, we cut three metal pieces of specific lengths, welded them to a short pole, and then welded the metal pieces onto the existing railing. With instruction I was able to eventually get the welding process down and help build a new section of railing. Everyday the engineers work on new projects and I’m excited to work with them again to potentially help with some of the ship’s systems or engines.
Currently we’re anchored just off Annapolis, Maryland where we continue to send out the survey launches each day to collect more data. Everyone here has been so welcoming and excited to teach me all about their jobs and the ship. Working with the survey team, the engineers, and even spending some time with the NOAA Corps officers on the bridge has been an incredible experience so far and I look forward to what else I’ll do in the coming weeks. Some of the projects that I’m excited for are working on the moving vessel profiler, collecting bottom samples from the bay floor, and doing more training and driving with the survey launches.
Week two (June 21 to 27)
My second week aboard the Thomas Jefferson is coming to an end and I’m glad to say that I’ve settled into a routine and into life at sea. We’ve spent this week near Annapolis, Maryland and have continued to send the launches out each day to collect more data.
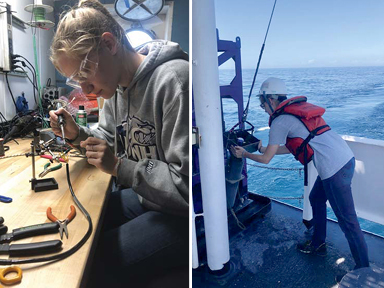
Aside from the sonar, one important piece of equipment aboard is the moving vessel profiler (MVP), which is an alternative to the conductivity, temperature, and depth (CTD) casts. While the CTD requires the vessel to be stopped, the MVP winches out a towfish off of the stern that collects the data while the ship can continue to move. Early in the week I worked on a small, MVP-related project with the electronics technician. The MVP winch cable is wrapped in a heavy Kevlar material, but due to the constant friction on one of the metal edges of the machine, the Kevlar sleeve was cut and exposed the winch cable that had begun to show slight wear itself. In order to fix this, we had to cut out the worn piece in the middle and solder the two ends together. After completing the soldering, we applied heat shrink tubing and tape to waterproof the connection.
While I’ve been working with other people and projects, most of my week has been spent going out onto the survey launches. One of our recent goals was finding the navigable area limit line (NALL) of an island that is currently getting rebuilt with dredged materials after nearly eroding away. The island, Poplar Island, is an important nesting ground for countless turtles, birds, and other species, and serves as an important wind and current break for the shoreline. With the island being rebuilt, finding the location and depth of the NALL is important for local boat traffic. The NALL is typically a depth of 3½ meters or the inshore limit of safe navigation.
The coxswains have also helped to teach me to drive the survey launches. Driving them is simple enough but tracing the selected survey lines within one meter of accuracy is incredibly difficult when the wind and water push the launch all over the place. Sometimes we would have to temporarily abandon our route to avoid large barges and ships that were anchored directly on top of our line. Awareness of the surrounding traffic, buoys, land formations, and other obstructions is crucial when navigating the small boats as well.

I also spent a lot of time working with survey technicians. One of the required tasks of the survey techs is to collect bottom samples of the area that we’re surveying. This sample is helpful for knowing what conditions ships will weigh anchor into as well as giving scientists a general idea of the composition of the seafloor in that area. In order to do this we used a grab sampler, a stainless steel scoop that springs shut once it hits the bottom of the bay. By attaching this to a pulley we were able to lower the sampler down over a dozen meters to grab a bottom sample.
At the end of the week we began our transit to around 40 nautical miles offshore. Once offshore, we’ll exclusively use the ship’s sonar and multibeam to map due to the increased depth and sea conditions. During our time there I’ll be helping to monitor the acquisition station that oversees the ship’s mapped course, the MVP casts, the sonar systems, and the collected data.