
A View into the History of the Cape Fear Region–Tens of Thousands of Years into the Past
By Cmdr. William Winner
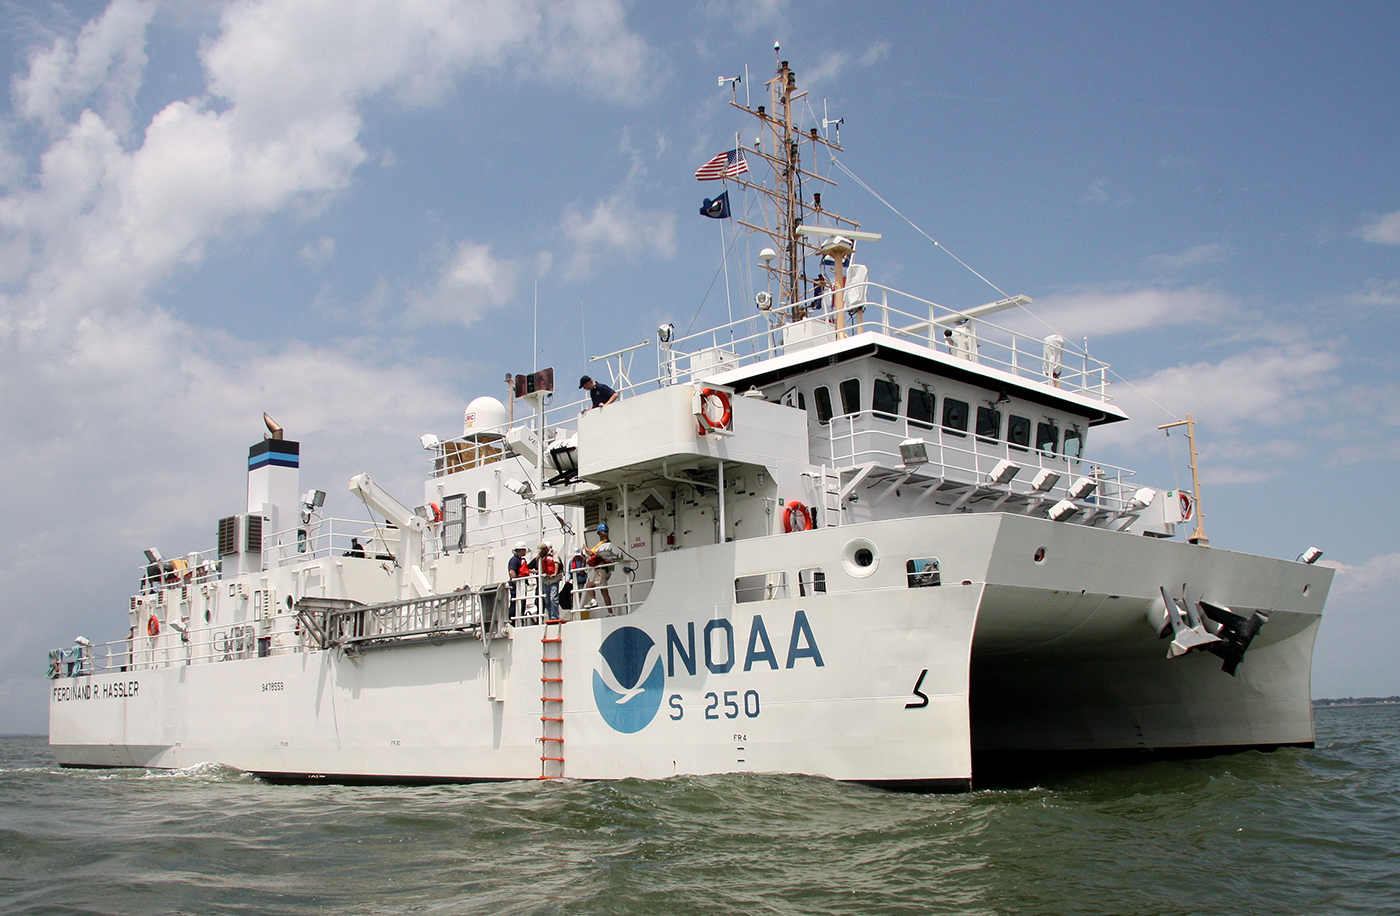
Over the spring and summer of 2024, NOAA Ship Ferdinand R. Hassler surveyed an area southeast of Cape Fear, North Carolina. This area is unique to the East Coast of the United States—whereas most of the East Coast’s seabed is sandy and has large areas of sand waves, this area does not have as much deep sand cover and instead features exposed underlying bedrock.
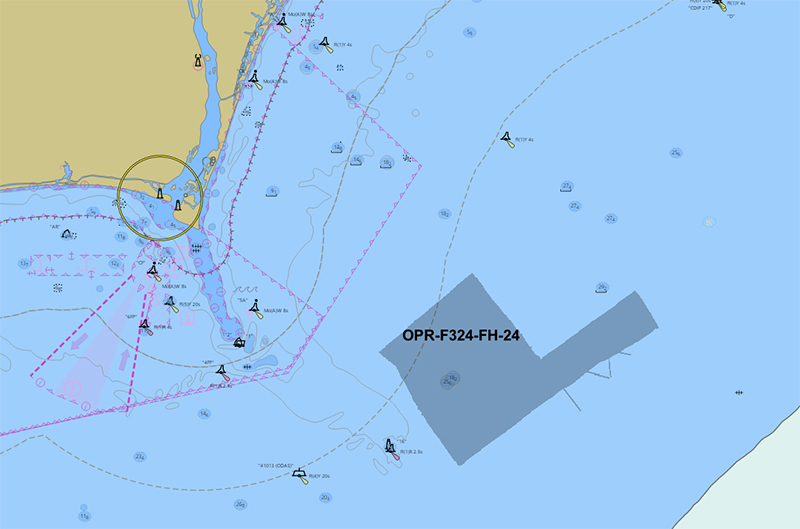
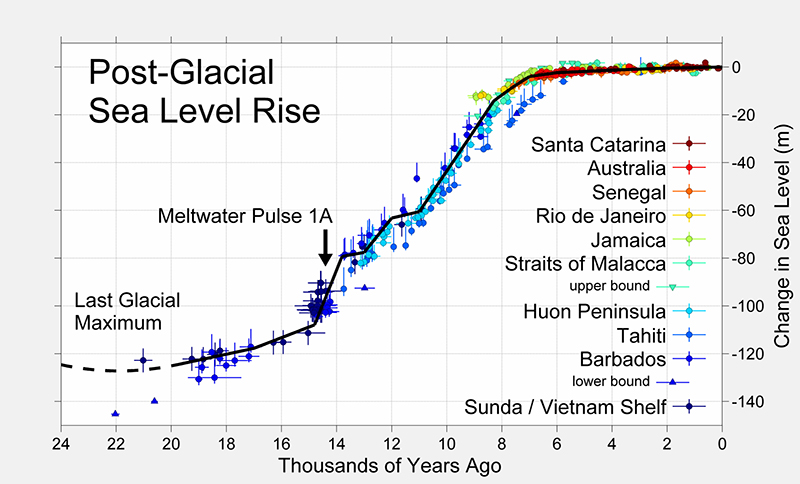
The area provides unique insights into what the Cape Fear region would have looked like tens of thousands of years ago. We can see evidence of ancient river systems and lakes, steep cliffs, and glacial grooves and channels visible in the rock surfaces. Based on the approximate underwater shoreline depths, our estimates are that these areas were flooded around eight to ten thousand years ago, based on prior research as seen below in the post-glacial sea level rise graph.
Ancient River Systems
This area is rich in palaeochannels. Palaeochannels—literally meaning “old channel”—are generally used to refer to rivers that are no longer in use above ground. Either the river no longer flows there because of a change in water level or change in the direction of the river, or the river has been filled in fully.
We believe that, due to the Gulf Stream predominantly moving water from the southwest to northeast, the Cape Fear ridge provides a natural barrier for sand. This results in sand building up along the Cape Fear ridge and not allowing the sand to continue over the ridge into the area of exposed bedrock.
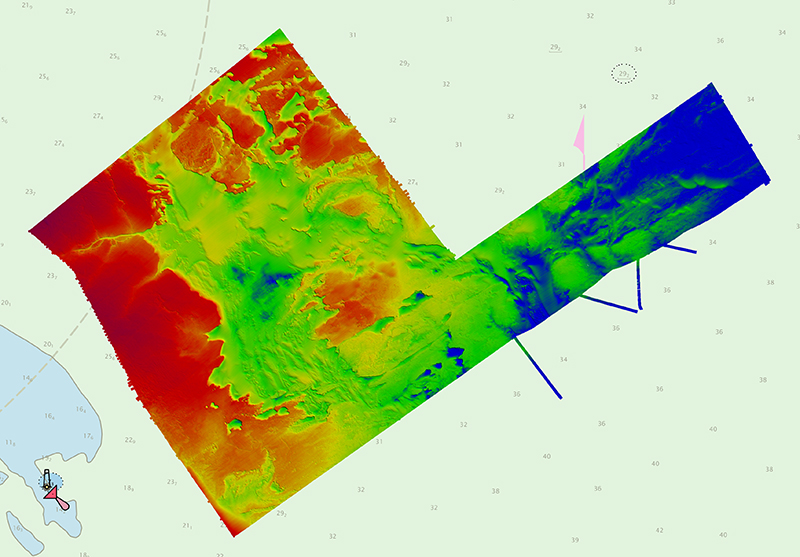
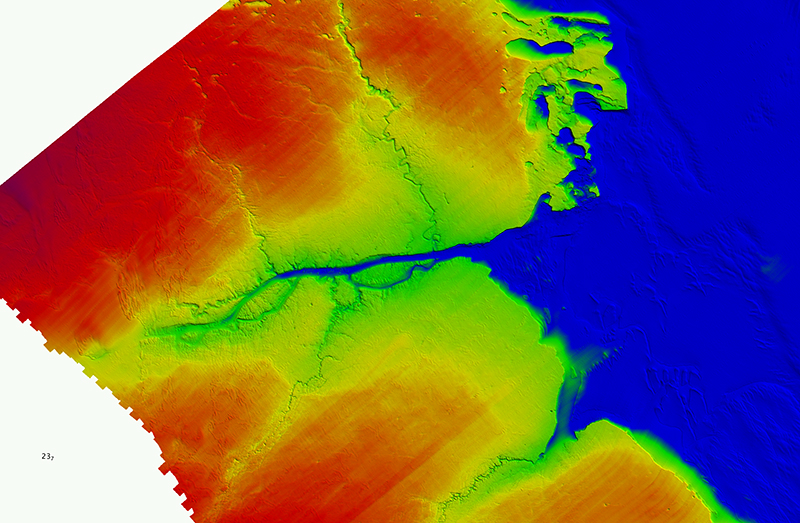
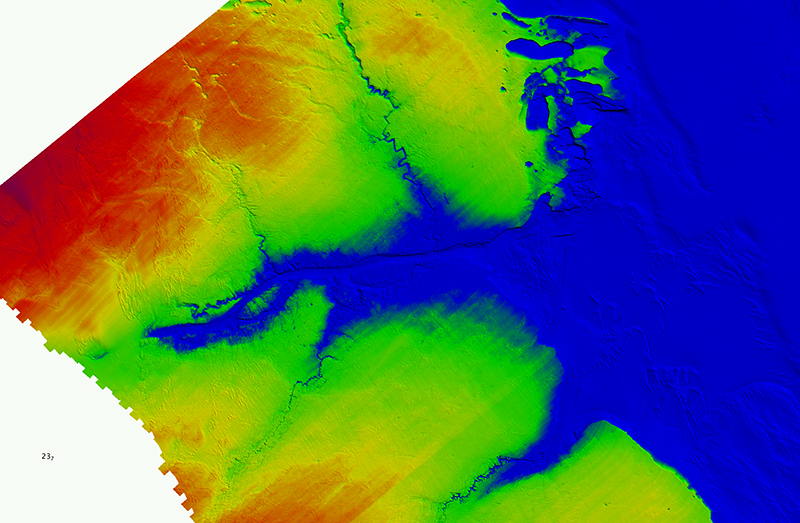
This provides unique opportunities to see where rivers would have run in times past. As seen in the images below there is clear evidence of previous river systems in the bathymetric data.
Additionally, the area is sediment starved because the adjacent rivers have low flow that feeds into the back-barrier island bays rather than the ocean, and currents prevent sediment transport around the capes that make the northern and southern boundaries of Onslow Bay, Cape Lookout and Cape Fear, respectively. The lack of sediment input means hard bottoms are exposed in much of Onslow Bay, and most sediment comes from erosion of local rock2,3
 An image of paleochannels visible in the bathymeric data.


Glacial Grooves?
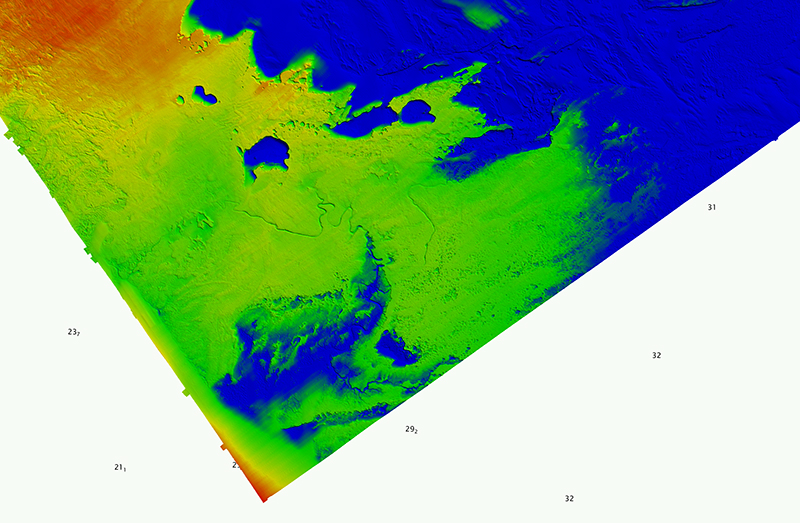
As glaciers grow, they drag rock fragments that cause small cuts through the bedrock creating grooves or glacial striations. For instance, in Wisconsin, large volumes of rock were dragged by glacial growth during the last ice age carving striations in the bedrock. We have what appear to be glacial striations in our survey. For reference, the fourth image above shows a closeup of the elevation changes. In certain spots, these grooves are only 20 centimeters tall, but with the advantage of looking at them from nearly 30 meters of elevation, we can see a larger picture. However, there’s no evidence that glaciers extended down this far south, So, what could have caused these large, linear grooves?
 An image of the bathymetyric data collected from within the survey area showing large, linear grooves.


Steep Cliffs
There are also several exposed cliffs in this area that range in height from a few meters, or six feet to up to seven meters, or 23 feet in height. They are throughout the area and match similar areas currently seen today in the Cape Fear region. In the images below, you can see areas with sheer drop-offs and their respective heights in the sonar data.
The upper surface in our data is a large unit of limestone. The limestone is laying on top of a unit of mudstone and sandstone, which is exposed in deeper areas. The cliffs are the transition between the two units. Surface sediments tend to collect in the deeper areas, especially in aprons at the bottom of the cliffs 2 . This aligns with our bottom samples. Interestingly, the apron around the cliff base shows up as a distinct area in parts of the backscatter mosaic in H13751, and the bottom sample there was dominated by broken shells. This indicates it is likely sourced from erosion of the adjacent fossiliferous limestone rather than a buildup of transported sediment 2 .
 An image of the bathymetyric data collected from within the survey area showing large steep cliffs.


Effects of changes in sea level
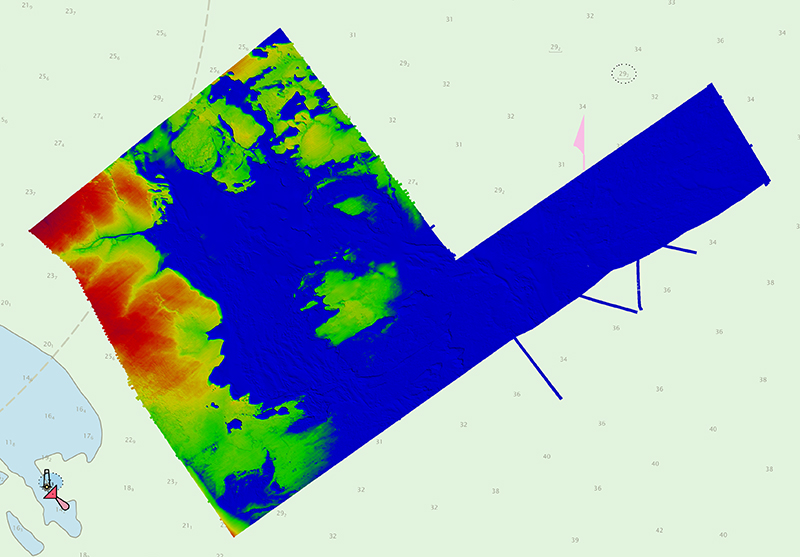
Because this area is not covered with large amounts of sand, it’s possible to imagine what sea level rise looked like tens of thousands of years ago. With evidence of paleochannels even in the deeper areas, we can simulate “flooding” the area. In the left image below, you can see the blue water level at 36 meters below the current Mean Lower Low Water (MLLW) level and the right image with the water level at 30 meters below MLLW.
In the image below you can see what would have happened to the floodplain of the river in the northwest corner of the area as the sea level continued to rise.
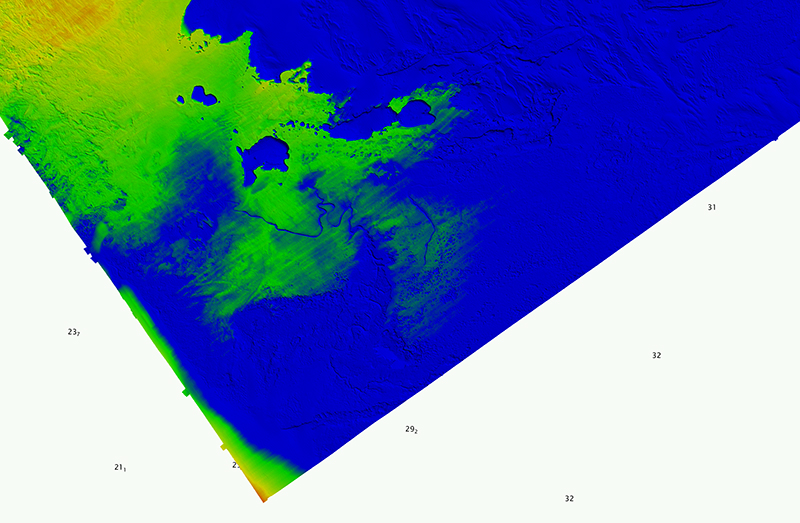
Similarly, you can see, in the images below, what the area in the southwest corner would have looked like as the water level rose from 31 meters deep to 29 meters deep.
A Glimpse into the Past
In 2023, NOAA hydrographers discovered similar geographic features near Wilmington, North Carolina. Read about those discoveries here. This is a unique area, particularly for the East Coast. The lack of deep sand cover provides a unique look at the bedrock of the area and provides us with the ability to “see” into the past and envision what the area would have looked like tens of thousands of years ago.
In the 2025 hydrographic field season, the Hassler will continue mapping the region, continuing to identify hazards and changes to the seafloor, provide critical data for updating NOAA nautical charting products, and improve maritime safety.
References
1Milne, Glenn A., Antony J. Long and Sophie E. Bassett (2005). Modelling Holocene relative sea-level observations from the Caribbean and South America. Quaternary Science Reviews, 24 (10-11). 1183-1202. doi:10.1016/j.quascirev.2004.10.005
2Riggs, S. & Snyder, S. & Hine, C. & Mearns, David. (1996). Hardbottom morphology and relationship to the geologic framework: Mid-Atlantic Continental Shelf. Journal of Sedimentary Research, 66. https://doi.org/10.1306/d4268419-2b26-11d7-8648000102c1865d
3McNinch, J. & Luettich, R. (2000). Physical processes around a cuspate foreland:: implications to the evolution and long-term maintenance of a cape-associated shoal. Continental Shelf Research. 20 (17). 2367-2389. https://doi.org/10.1016/S0278-4343(00)00061-3