
The federal Interagency Working Group on Ocean and Coastal Mapping recently released the sixth annual report on progress made in mapping U.S. ocean, coastal, and Great Lakes waters. To safeguard our national security and economic prosperity, ocean mapping, exploration, and characterization is foundational to maritime commerce, domestic energy and seafood production, tourism and recreation, and understanding of our natural resources, among other interests. The 2020 National Strategy for Mapping, Exploring, and Characterizing the United States Exclusive Economic Zone (NOMEC) makes comprehensive ocean mapping a priority for the coming decade. The Unmapped U.S. Waters report tracks progress toward these important goals.
Pulling from an analysis of publicly available bathymetry, the report presents the percentage of unmapped U.S. waters by region and shows our progress towards filling these basic seafloor and lakefloor mapping gaps with each passing year. Notable changes in this 2025 report include expanding the geographic scope of U.S. waters to include the U.S. continental shelf beyond the 200 nautical mile exclusive economic zone, which the U.S. proclaimed in December 2023 (88 FR 88470). This action expanded the total area of interest for mapping progress tracking from 3,590,600 square nautical miles to 3,878,700 square nautical miles.
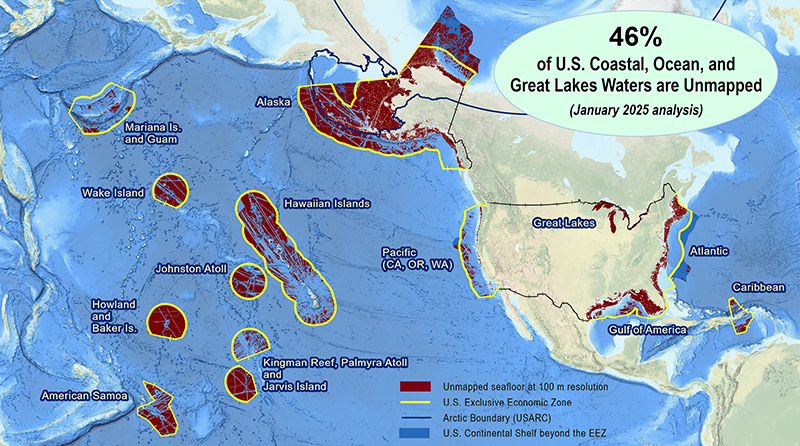
At the end of 2024, 71,500 square nautical miles of new bathymetric data coverage were added since the last report, which moved us from 48% unmapped at this time last year to 46% unmapped.
Progress was made on a number of fronts, but most notably in areas where regional campaigns are established to facilitate collaborative data acquisition activities and increase data sharing, in accordance with the NOMEC Strategy goals.
More than half of the total new bathymetry coverage gains are in the U.S. Pacific Remote Island territories and Hawaiian waters, which are encompassed by the Beyond the Blue: Illuminating the Pacific campaign. These bathymetric gains were predominantly in water depths deeper than 200 meters and conducted aboard the NOAA Ship Okeanos Explorer through focused mapping expeditions around the Hawaiian Islands and Johnston Atoll. Additional bathymetric contributions in the Western Pacific were also made through NOAA Ocean Exploration funded expeditions executed via the Ocean Exploration Cooperative Institute.
The Alaska region, home of the Seascape Alaska campaign, saw the second largest gains in new bathymetric data coverage. Major contributions include bathymetry collected as part of a federal/academic collaboration aboard the U.S. Coast Guard Cutter Healy in the Chukchi and Beaufort Seas. Additional data comes from NOAA hydrographic surveys conducted during the 2022-2024 field seasons, including an ongoing U.S. Geological Survey/NOAA co-funded mapping project south of Kodiak Island, as well as the 2023 Seascape Alaska expeditions in the Gulf of Alaska.
The Great Lakes, home of the Lakebed 2030 campaign, moved from 87% to 85% unmapped. Much of that progress is attributable to recent NOAA multibeam sonar hydrographic surveys in Lake Michigan and bathymetric lidar collection efforts, as well as the public release of recent U.S. Army Corps of Engineers Joint Airborne Lidar Bathymetry Technical Center of Expertise lidar collections.
The Pacific Coast, home of the EXPRESS campaign, moved to only 15% unmapped after adding another 4,100 square nautical miles of new bathymetric data coverage. The NOAA EXPRESS: West Coast Exploration expedition series off Northern California are major contributors to those gains.
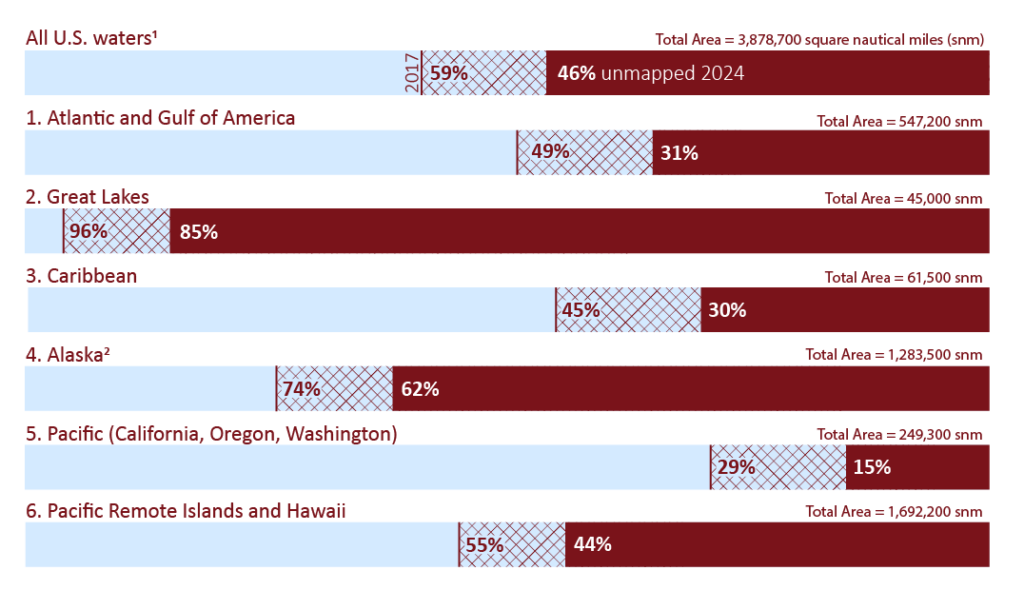
Percent of U.S. waters that remain unmapped as of January 2025:
- U.S. total1 – 46% of 3,878,700 square nautical miles (snm)
- Atlantic and Gulf – 31% of 547,200 snm
- Great Lakes – 85% of 45,000 snm
- Caribbean – 30% of 61,500 snm
- Alaska2 – 62% of 1,283,500 snm
- Pacific (California, Oregon, Washington) – 15% of 249,300 snm
- Pacific Remote Islands and the State of Hawaii – 44% of 1,692,200 snm
1Areas include the full extent of the U.S. Continental Shelf, as declared in 88 FR 88470.
2The Arctic portion of all U.S. waters in the Alaska region is 787,000 snm and 69% unmapped at the end of 2024.
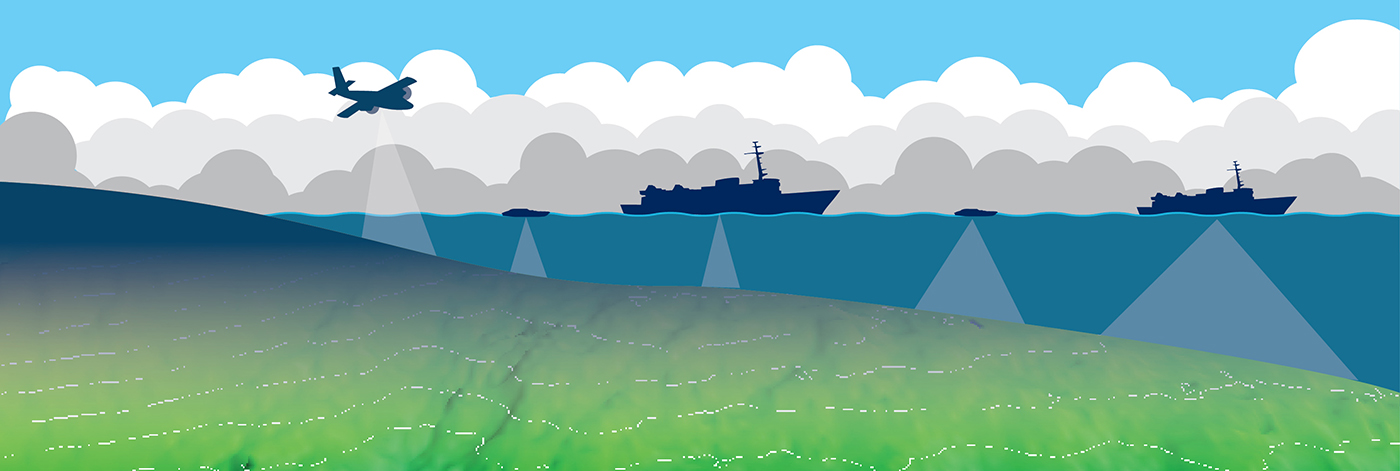
Multibeam and lidar surveys are the two primary sources of bathymetry needed to fill these gaps. In support of the integrated ocean and coastal mapping goal to “map once, use many times,” all of the data collected in this effort are publicly available to benefit numerous users. For the latest status on these efforts and how you can contribute, visit https://iocm.noaa.gov/seabed-2030-status.html.