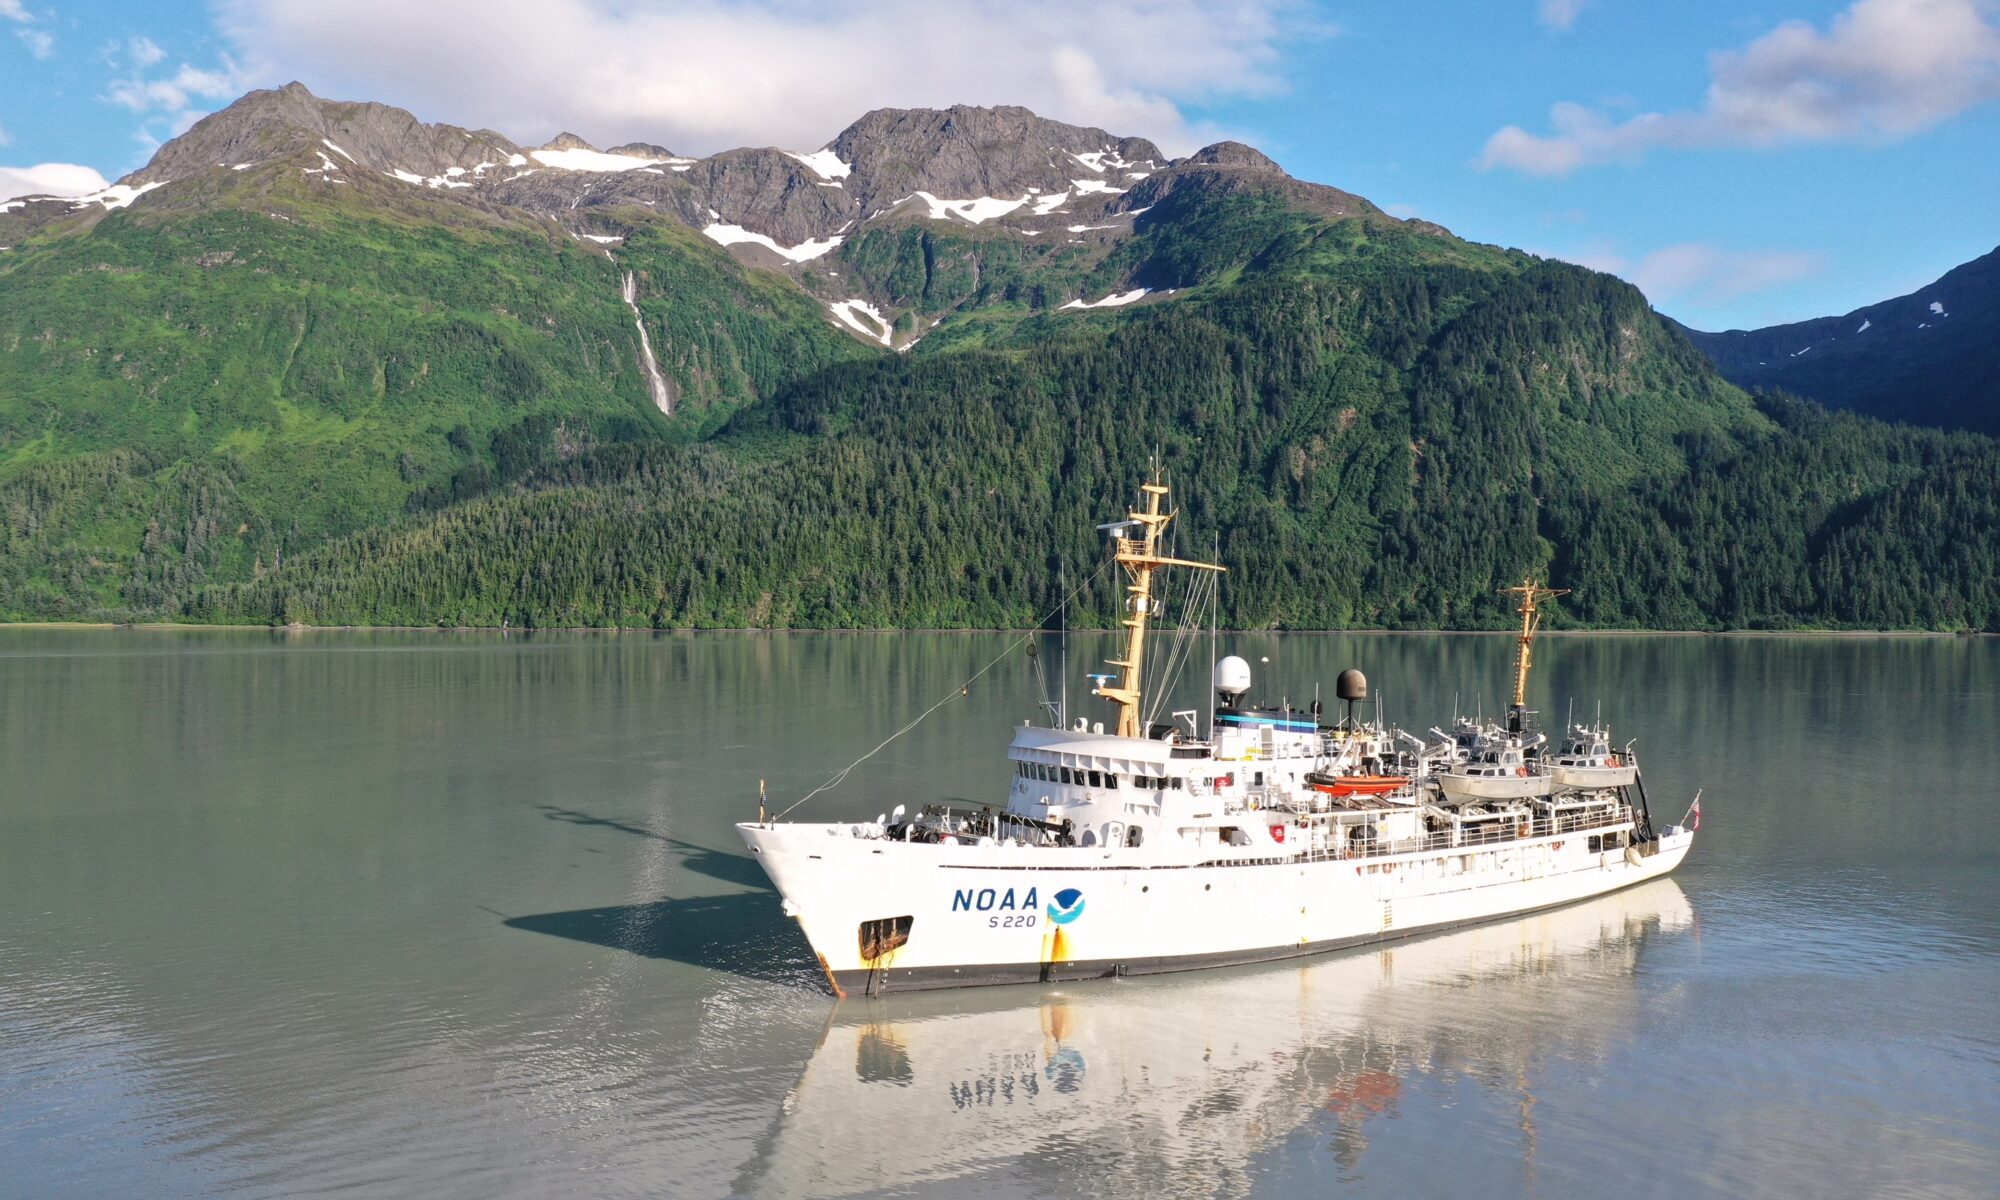
Supporting the mighty Columbia River through strong partnerships

An image of the Hood River Bridge crossing the Columbia River.

The Columbia River and its tributaries comprise one of the largest river systems in North America, flowing from British Columbia, Canada and through the United States to its final destination, the Pacific Ocean. The river is used extensively for transporting various cargoes into and out of the United States including forest products, grain, containerized cargo and bulk products like salt and cement. Upstream of Portland, barge and recreational traffic navigate the river to Kennewick, Washington or Lewiston, Idaho on the Snake River. For the people that use this river for its resources, this traffic almost assuredly has some type of ecological impact.

Continue reading “Supporting the mighty Columbia River through strong partnerships”

NOAA contributes to Empowering Women in Hydrography through at-sea experience, part 3

An image of Firosa Tomohamat, from Suriname’s Maritime Authority, sitting on a bench on deck 2 of NOAA Ship Thomas Jefferson.

The Empowering Women in Hydrography project is a global effort led by the International Hydrographic Organization and Canada that seeks to initiate, organize and track a series of activities and initiatives which will enable more women to participate equitably in the field of hydrography and to assume leadership roles within the hydrographic community. NOAA is contributing to the project via an ‘at-sea experience’ on NOAA hydrographic ships for three women each year over the four year lifespan of the project. After a global call for nominations, three women were selected to join NOAA ships for the 2022 survey season. Firosa Tomohamat from Suriname’s Maritime Authority, joined NOAA Ship Thomas Jefferson from August 8 to 26, 2022 while surveying the Great Lakes.

Continue reading “NOAA contributes to Empowering Women in Hydrography through at-sea experience, part 3”

Help keep nautical charts up to date through citizen science

A graphic showing an artistic Citizen Science banner.

NOAA maintains a suite of nearly 2000 electronic navigational charts (NOAA ENC®), as well as the ten volume United States Coast Pilot®. The seafloor and coastline are dynamic environments, which means that our products are constantly scrutinized for possible changes. Each year we make thousands of updates to ENCs, ensuring we are providing the most accurate products possible. The source data for most of these updates comes from NOAA or contractor surveys or from our federal partners, such as the U.S. Army Corps of Engineers and the U.S. Coast Guard. However, we also rely on many other data sources to help keep our ENCs up-to-date.

Continue reading “Help keep nautical charts up to date through citizen science”

NOAA contributes to Empowering Women in Hydrography through at-sea experience, part 2

NOAA ship Thomas Jefferson from survey launch 2904 at sunrise.

The Empowering Women in Hydrography project is a global effort led by the International Hydrographic Organization and Canada that seeks to initiate, organize and track a series of activities and initiatives which will enable more women to participate equitably in the field of hydrography and to assume leadership roles within the hydrographic community. NOAA is contributing to the project via an ‘at-sea experience’ on NOAA hydrographic ships for three women each year over the four year lifespan of the project. After a global call for nominations, three women were selected to join NOAA ships for the 2022 survey season. Chiaki Okada from the Hydrographic and Oceanographic Department, Japan Coast Guard, joined NOAA Ship Thomas Jefferson from July 25 to August 6, 2022 while surveying the Great Lakes.

Continue reading “NOAA contributes to Empowering Women in Hydrography through at-sea experience, part 2”

Surveying south of Cape Cod, Massachusetts in transit to the Great Lakes

NOAA Ship Thomas Jefferson underway in the Chesapeake Bay performing pre-season testing.

By Hydrographic Assistant Survey Technician Sarah Thompson

April 10, 2022 marked the beginning of NOAA Ship Thomas Jefferson and her crew’s field season and transit up through the St. Lawrence River, Lake Ontario, and into Lake Erie. This field season, Thomas Jefferson’s base of operations will be in Cleveland, Ohio and has the distinction of being the first NOAA ship to survey the Great Lakes in over 30 years. On the way, Thomas Jefferson had the opportunity to respond to a U.S. Coast Guard request to survey and obtain modern bathymetry on Pollock Rip Channel off the Massachusetts coast.

Continue reading “Surveying south of Cape Cod, Massachusetts in transit to the Great Lakes”

Have it your way – creating customized nautical charts using the latest data

An image showing the output of the NOAA Custom Chart application with a chart covering the western side of the Chesapeake Bay.

Nautical charts have always contained a great amount of information – even more so with electronic navigational charts. This information is constantly being updated, necessitating the need to keep your nautical chart suite as current as possible. The Office of Coast Survey’s online NOAA Custom Chart application enables users to create nautical charts directly from the latest official NOAA electronic navigational chart (NOAA ENC®) data. Users now have the ability to create their own nautical charts using individually set parameters, and then save this custom nautical chart as a file that can be viewed or printed.

Continue reading “Have it your way – creating customized nautical charts using the latest data”

NOAA focuses on the Great Lakes for the 2022 field season

NOAA Ship Thomas Jefferson shown from the bridge wing of a passing ship outside of Montreal, Quebec.

In 2022, NOAA and NOAA contractors will survey U.S. coastal waters and beyond, including multiple missions in the Great Lakes. As the volume, value and size of marine vessels in U.S. waters continues to grow, it is essential that NOAA increase the accuracy and frequency of surveys. A great amount of data on nautical charts of the Great Lakes is more than 50 years old, and only about 5 to 15 percent of the Great Lakes are mapped to modern standards using remote sensing methods such as light detection and ranging and sound navigation and ranging.

Continue reading “NOAA focuses on the Great Lakes for the 2022 field season”

Coast Survey’s mobile integrated survey team goes to Antarctica

An image of the United States Coast Guard cutter Polar Star docked at McMurdo Station ice pier on a relatively ice free day for Winter Quarters Bay.
By, Annie Raymond

In 1959, following the International Geophysical Year of 1957-58, scientists from twelve nations conducting active research in Antarctica came together and signed the Antarctic Treaty. In the years following, 42 additional countries acceded to the treaty. The treaty preserves the entire continent and surrounding waters solely for purposes of peaceful scientific collaboration and bans resource extraction and military activity. McMurdo Station on Ross Island, operated by the United States through the United States Antarctic Program, a branch of the National Science Foundation (NSF), has emerged as the largest year-round station and primary logistics hub for the region. The first U.S. Operation Deep Freeze happened prior to and in support of the International Geophysical Year of 1957-58. Since then, Operation Deep Freeze has continued annually and has become the name for supply sealift missions to McMurdo, delivering fuel, food, and supplies to scientists in Antarctica.

Continue reading “Coast Survey’s mobile integrated survey team goes to Antarctica”

Coast Survey launches NOAA Chart Display Service

This is a graphic showing an electronic navigational chart depicting the entrance to the Columbia River and Astoria, Oregon. Graphical information on the chart is rendered by the new NOAA Chart Display Service and shows traditional paper chart symbols.

The new NOAA Chart Display Service (NCDS) renders NOAA electronic navigational chart (NOAA ENC®) data with “traditional paper chart” symbology in online and offline applications for which a basemap of nautical chart data is desired, including GIS, web-based, and mobile mapping applications. The new service uses symbols, labels, and color schemes familiar to those who have used NOAA paper nautical charts or the NOAA Custom Chart application. NCDS is available as Esri REST Map Service, OGC Web Map Service (WMS), and MBTiles formats.

Continue reading “Coast Survey launches NOAA Chart Display Service”