By Lt. j.g. Michelle Levano
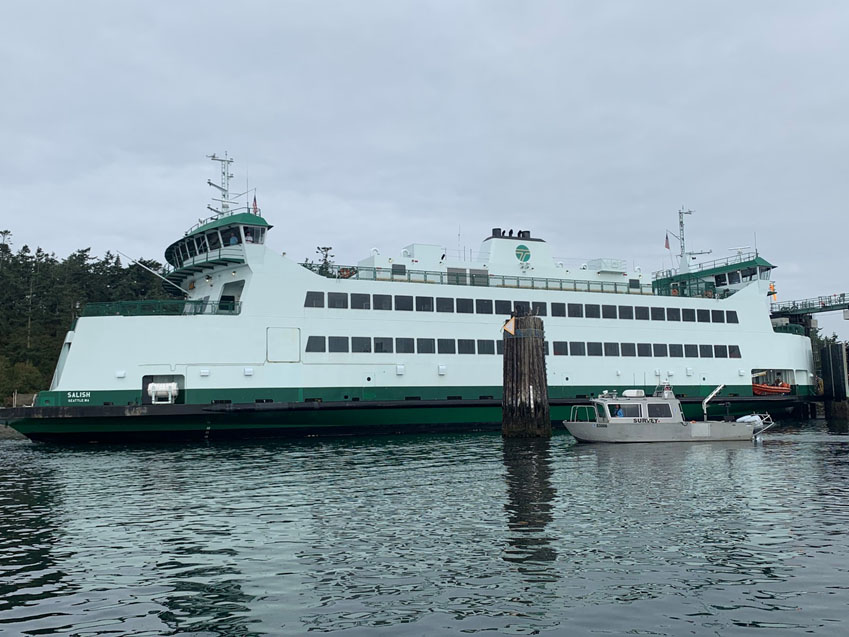
If you have spent time on the water in Puget Sound, you have probably seen the large, distinct green and white vessels. These vessels move passengers, vehicles, and cargo across Puget Sound to the San Juan Islands and to Victoria, Canada, year round. They are a part of the Washington State Department of Transportation ferry system. The state has been operating ferries since 1951, and intended to run the ferry service until cross Sound bridges could be built. These bridges were never built, and the state continues to operate the ferries to this day. As of last July, there are 22 state-operated ferries on Puget Sound, with the largest vessel able to carry 2500 passengers and 202 vehicles.
One of these routes is a 30-minute transit from Coupeville, WA, to Port Townsend, WA, at the mouth of Puget Sound. This route carries roughly 820,000 passengers a year, and saves travelers from a five- hour drive around the Sound. n 2013 the Washington Department of Ecology and the Applied Physics Laboratory at the University of Washington installed instruments on board to measure the velocity of current at the entrance of the Sound. Due to the shallow depth of the ferry terminal at Coupeville, extreme (low) tidal conditions interrupt this ferry route up to three times a month.

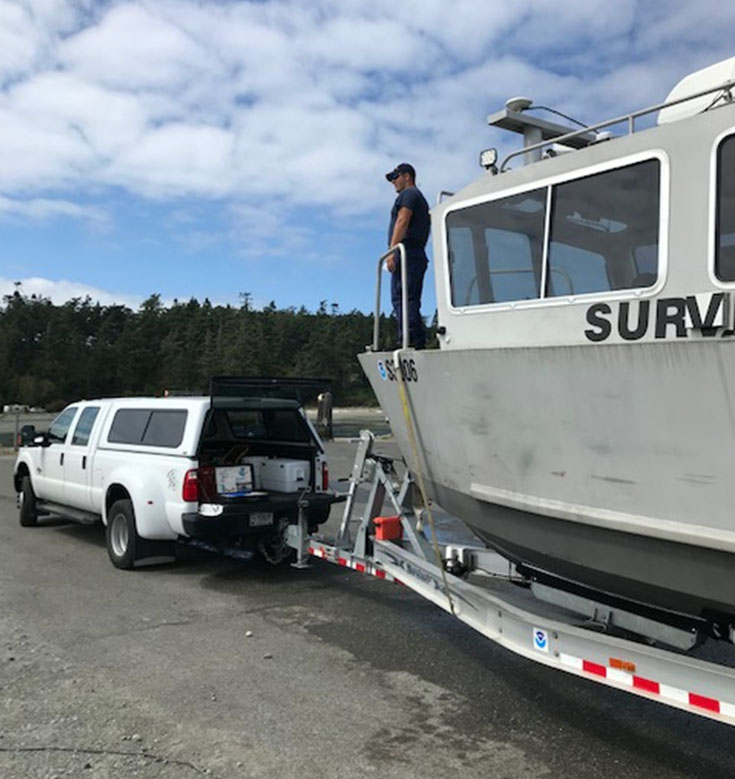
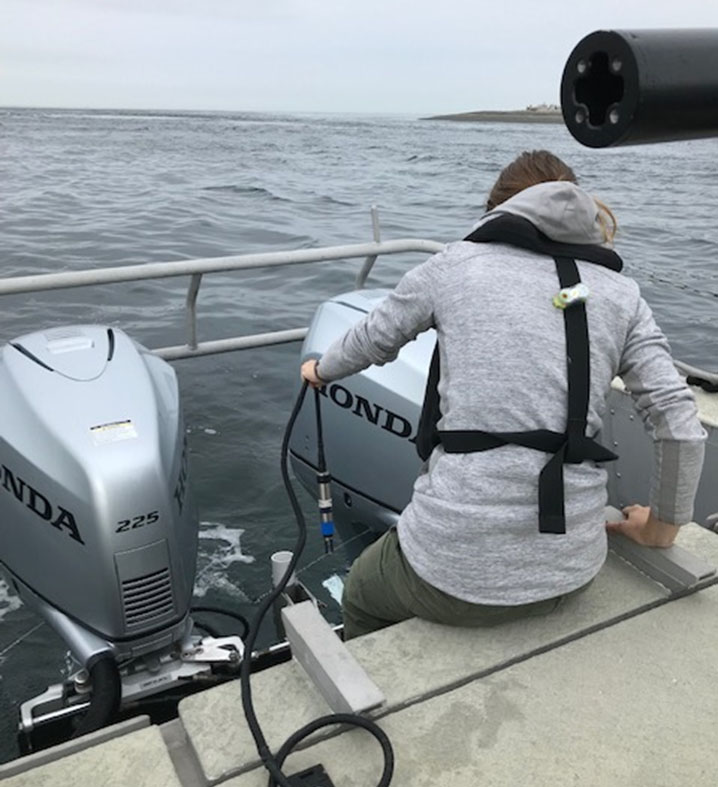
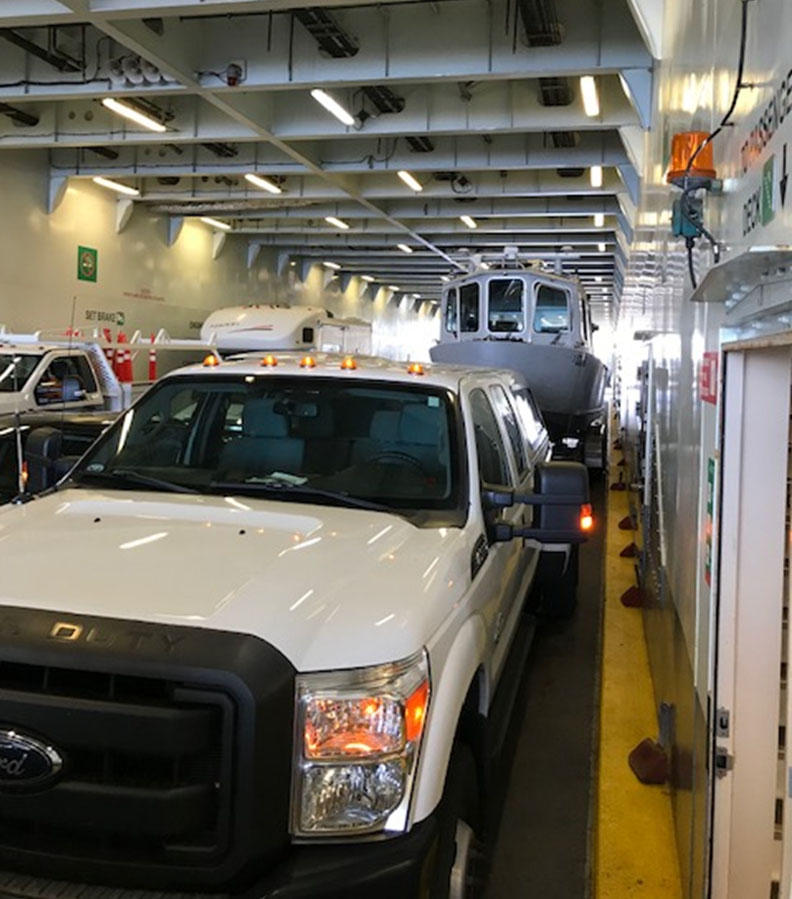
NOAA’s Northwest and Pacific Islands Navigation Manager Crescent Moegling received a survey request from the Washington State Ferries in early summer of 2019 to survey this route. Following completion of a routine survey in Bellingham Bay, Navigation Response Team – Seattle (NRT-Seattle) along with augmenters Lt j.g. Joshua Fredrick, NOAA’s Center for Operational Oceanographic Products and Services, and Adrian Biesel, an intern at NOAA Office of Coast Survey’s Pacific Hydrographic Branch, traveled to Oak Harbor, Washington, on August 14. After safety and familiarization briefings, NRT-Seattle got underway from the Fort Casey State Park boat ramp daily to collect multibeam data. The team completed this request on August 19.


The density of the team’s data allows for confident detection of 1×1 meter objects on the seafloor. In addition to collecting information on the depth of the seafloor, the team also verified, investigated, and updated several features on the chart including but not limited to kelp beds, fog signals, and pier pilings.

