
The Interagency Working Group on Ocean and Coastal Mapping (IWG-OCM) released the second annual report on the progress made in mapping U.S. ocean, coastal, and Great Lakes waters. The depth, shape, and composition of the seafloor are foundational data elements that we need to understand in order to explore, sustainably develop, conserve, and manage our coastal and offshore ocean resources. The 2020 National Strategy for Mapping, Exploring, and Characterizing the United States Exclusive Economic Zone and the global Seabed 2030 initiative make comprehensive ocean mapping a priority for the coming decade. The Unmapped U.S. Waters report tracks progress toward these important goals.
Pulling from an analysis of publicly available bathymetry, the report presents the percentage of unmapped U.S. waters by region and shows our progress towards filling these basic bathymetry data gaps with each passing year. At the end of 2020, the latest analysis yielded a 1% gain, equal to 36,000 square nautical miles, of new bathymetry since the last report.
“While we would like to see greater gains each year to meet our collective target of 150,000 square nautical miles annually, this one percent change reflects valuable contributions from government, private sector, philanthropic and academic survey efforts. Sharing mapping data, and coordinating on new acquisitions and technical innovations to make ocean mapping more efficient, are key elements of the strategy to comprehensively map U.S. waters – we welcome all contributors.”
—Ashley Chappell, NOAA’s Integrated Ocean and Coastal Mapping coordinator.
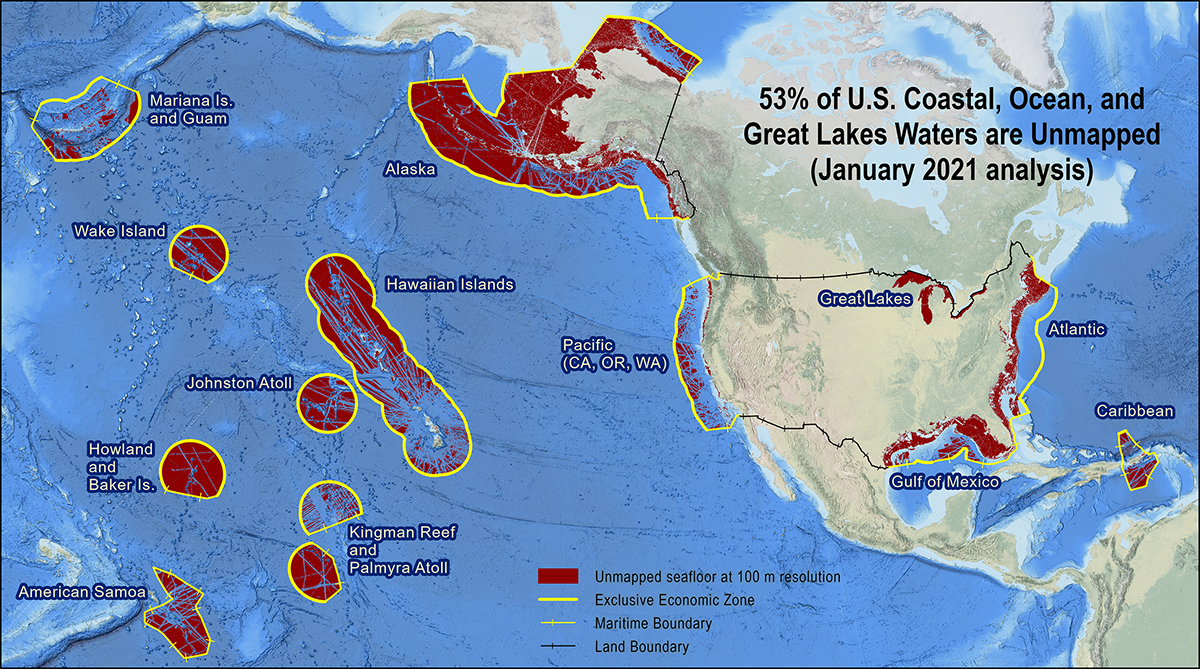
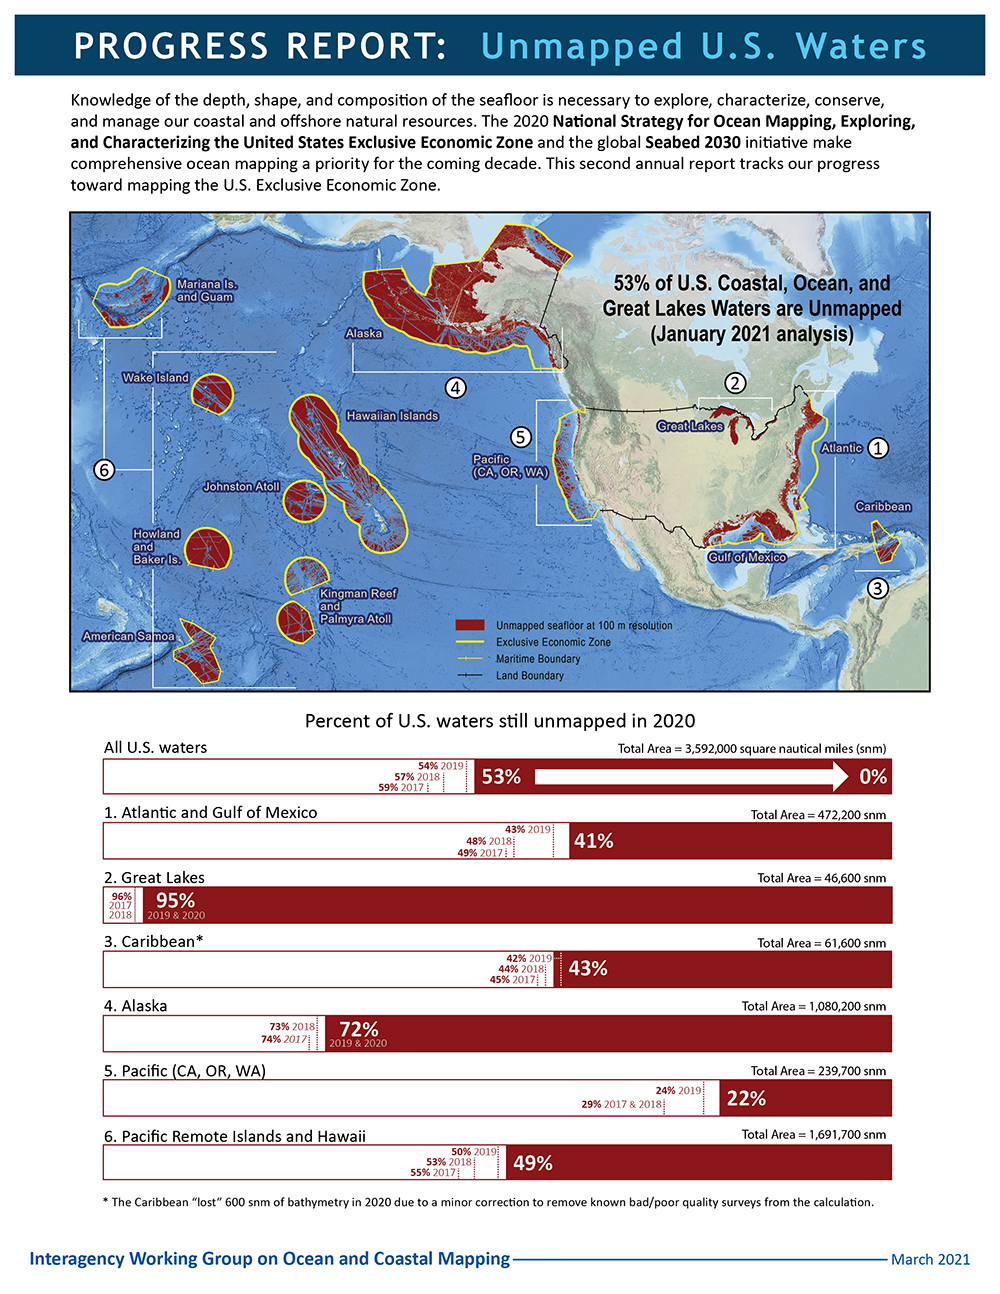
Percent of U.S. waters that remain unmapped as of January 2021:
- U.S. total – 53% of 3,592,000 square nautical miles (snm)
- Atlantic and Gulf of Mexico – 41% of 472,200 snm
- Great Lakes – 95% of 46,600 snm
- Caribbean – 43% of 61,600 snm
- Alaska – 72% of 1,080,200 snm
- Pacific (California, Oregon, Washington) – 22% of 239,700 snm
- Pacific Remote Islands and Hawaii – 49% of 1,691,700 snm
Multibeam and lidar surveys are the two primary sources of bathymetry needed to fill these gaps. In support of the integrated ocean and coastal mapping goal to “map once, use many times,” all of the data collected in this effort are publicly available to benefit numerous users. For the latest status on these efforts and how you can contribute, visit http://iocm.noaa.gov.
Thank you for sharing the important ideas to everyone
Wow, thank you very much for what you’ve accomplished. Thank you very much for your thoughtfulness. Stay nice, unbelievably just, okay?
I really like your blog. One of the most interesting and best blogs I’ve ever seen. Thank you for your patronage.
Greetings:
I just do not get it. You describe the knowledge collected as “necessary to explore, characterize, conserve, and manage our coastal and offshore natural resources”, yet your survey distribution largely ignores the continental shelves in favor of mapping vast areas of abyssal seafloors. What resources are you addressing there, as opposed to 99% of the fisheries resources living shallower then 500m? Bathymetry is very important to managing and conserving fish habitats, but research in many of these areas languishes with data collected with poor resolution and questionable accuracy of locations. I know that multibeams cover much more area in deep depths and it may seem hopeless to cover the continental shelves with the narrower swaths achieved there. However, you do not describe what ‘resources’ are being illuminated by the bathymetery of the ocean basins? Yes, you can check off much larger percentages of the EEZ by running back and forth over abyssal plains and just getting up to the foot of the continental slopes. If these are Defense issues (submarine detection?) then the DOD should be paying for it. I just cannot think of any other resources current being used by the United States in the areas where you have been focusing for the last 20 years. Please enlighten me.
Thank you for your engagement and observations on this topic. The survey distribution (shown as blue in the unmapped map) is based on various stakeholder requirements over the last 50+ years. How and why certain areas have been mapped more completely than others is a complex topic, but I will note that some of the largest mapped areas off the East Coast and Alaska are the result of interagency efforts in support of the U.S. extended continental shelf project, which also ultimately benefited other stakeholders. For example, in the Atlantic, discoveries made during those cruises led to the establishment of Northeast Canyons and Seamounts Marine National Monument a few years later. There is additional information about the analysis leading up to this progress report at https://iocm.noaa.gov/seabed-2030.html. Ultimately, the goal is to map all U.S. ocean, coastal, and Great Lakes waters by 2040 (areas deeper than 40m by 2030). In some cases, areas have already been mapped, but that data has not been shared. So, filling the gaps is both an exercise in discovering previously collected data and making it available as well as collecting new data.