

On April 1, 2021, NOAA’s Office of Coast Survey released NOAA Custom Chart version 1.0, a dynamic map tool which enables users to create their own paper and PDF nautical charts derived from the official NOAA electronic navigational chart (NOAA ENC®), NOAA’s premier nautical chart product.
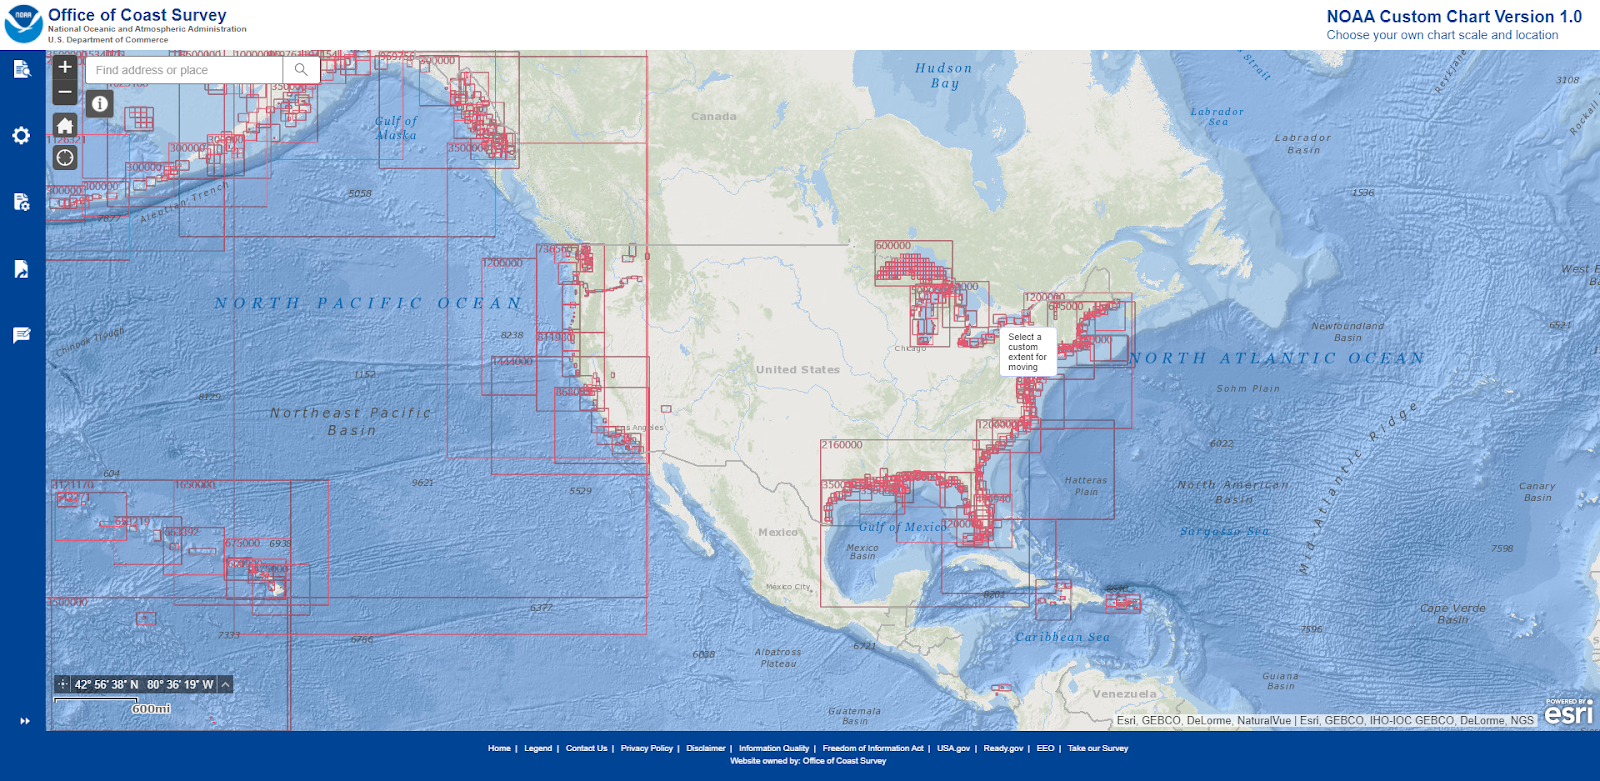
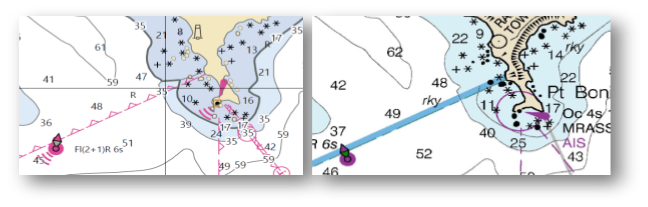
The online tool uses official NOAA ENC data to create nautical charts with customized scale and extent, which can then be downloaded as PDF files. The charts feature traditional chart components such as paper chart symbology – including NOAA-style symbols for aids to navigation and dangers to navigation, and a quality of data diagram. While these printable PDFs look a bit different from traditional paper charts, and initially will not meet carriage requirements for regulated vessels, NOAA Custom Chart utilizes the best available data, delivers an improved service for users, and ensures consistency between ENC and NOAA Custom Chart PDFs, resulting in the best quality chart regardless of the final format.
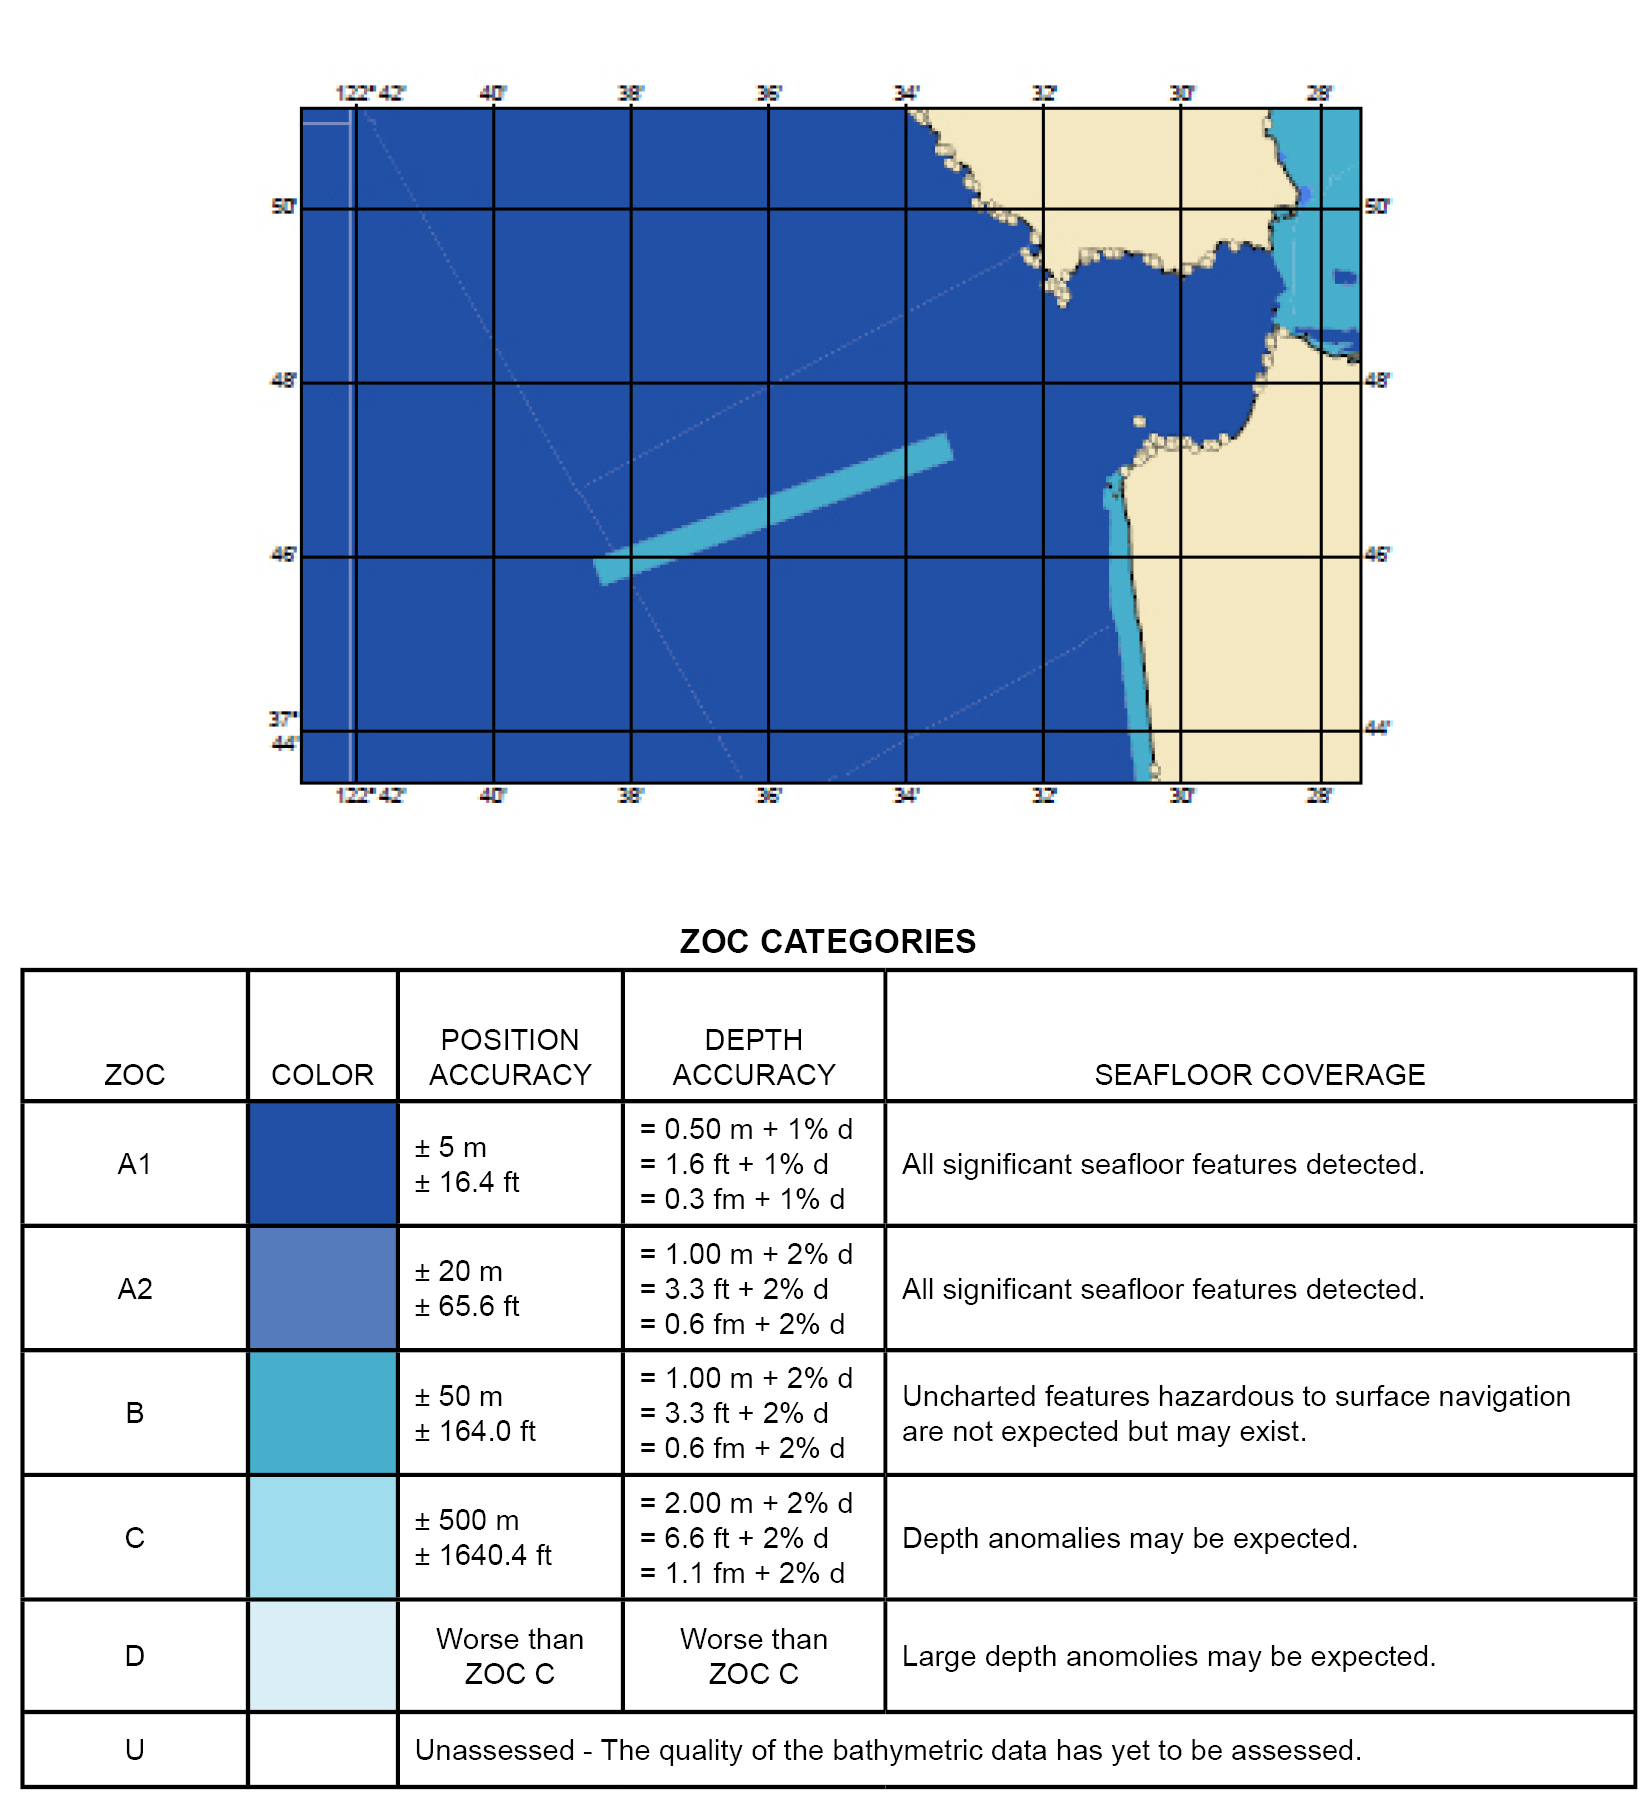
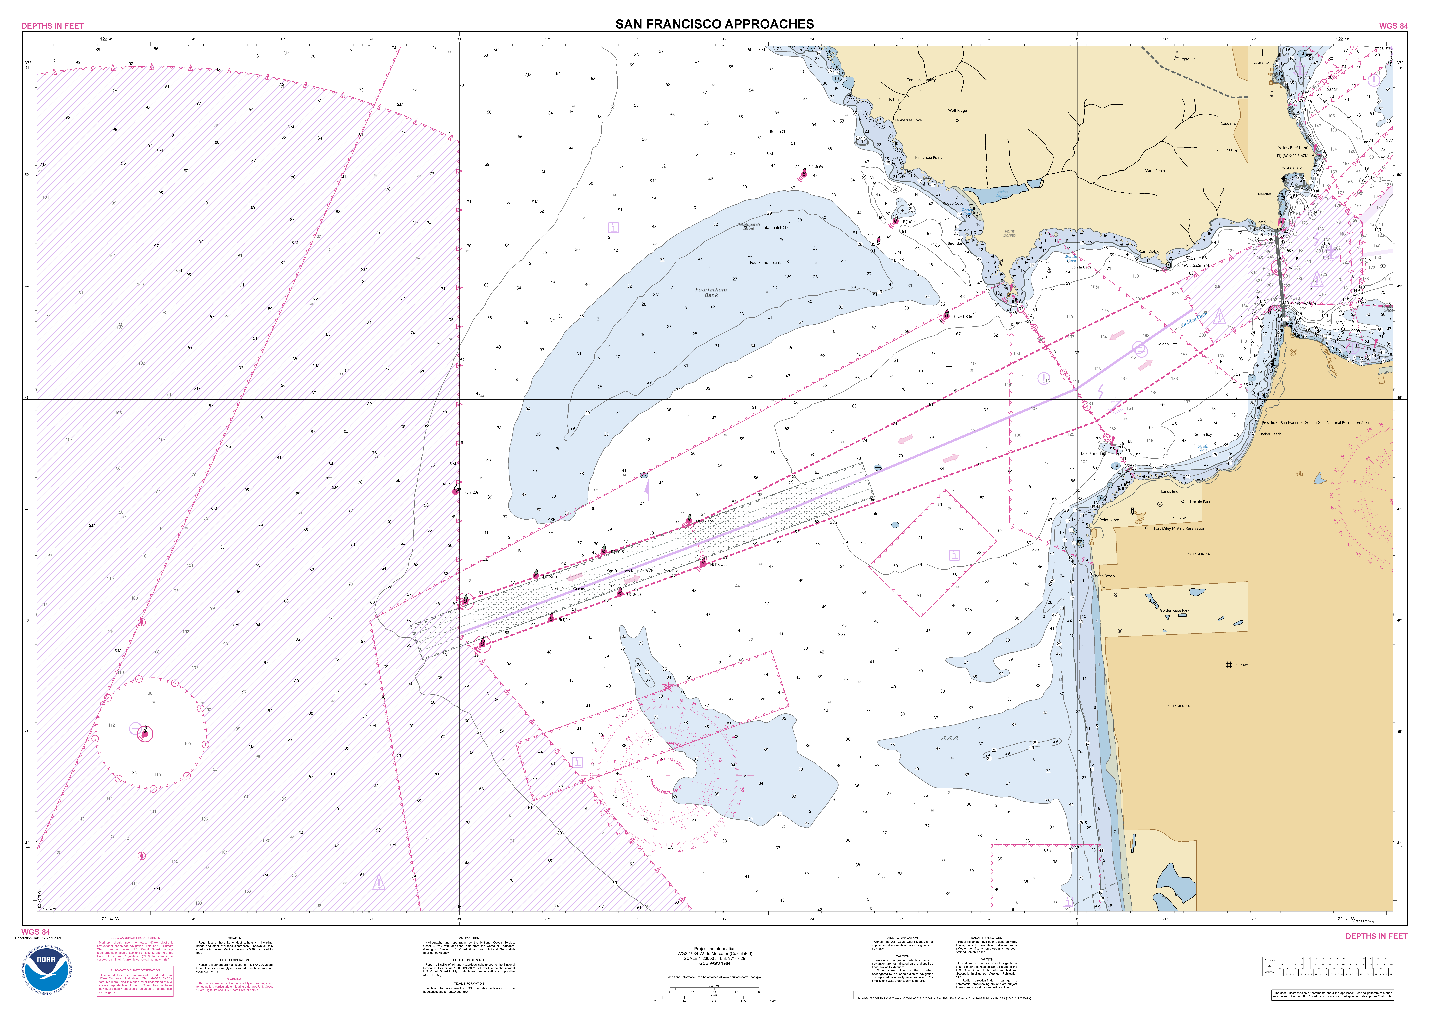
Additional improvements from the previous prototype version include a NOAA-style chart layout with marine notes and scale information, unit conversion table, the scale calibration note, and additional information and comment request notes. Zone of confidence (ZOC) diagrams are also included in version 1.0, which show the assessed quality of hydrographic data. ZOC diagrams provide information similar to that found in the familiar paper chart source diagram, with the assessment categories used on NOAA ENC products to provide more detailed information. The ZOC diagram and explanatory table with legend are found on the second page of all NOAA Custom Chart PDF files. Expanded chart notes appear on subsequent pages and include information about the chart, such as sounding and vertical datum, cautionary notes for the charted area, and information on where to access supplemental information.
NOAA looks forward to future enhancements, which include improved compass rose placement, enhanced text labels, options for use of additional types of chart symbology, and a subscription service where users can store chart download information and download updated versions when necessary. We are also in discussions with our Print on Demand (POD) chart vendors about the ability to provide printing services of NOAA Custom Charts in the future.
Traditional paper and raster charts are still updated on a weekly basis with critical navigation changes that are released in the U.S. Coast Guard Local Notice to Mariners. However, other changes, such as data from new shoreline and bathymetric surveys, and other non-critical changes – which are routinely applied to the ENC – are no longer compiled onto traditional paper and raster charts. NOAA will end production of its traditional paper nautical charts by January, 2025, but will continue to provide users access to paper charts created directly from ENC data via the NOAA Custom Chart tool.
A User Guide is available to help users navigate the NOAA Custom Chart tool. NOAA is actively making improvements to the NOAA Custom Chart tool, and is interested in hearing about users’ experiences and getting suggestions for additional enhancements. You can provide your input through the online ASSIST customer feedback tool.
Related to this release, check out the latest NOAA Ocean Podcast on the NOAA Custom Chart tool featuring Capt. E.J. Van Den Ameele, chief of NOAA’s Marine Chart Division, discussing how the transition from paper charts will affect mariners, why electronic charts offer many advantages over paper, and the NOAA Custom Chart tool.
Want to appreciate all your efforts in this respect. Good thing.-Good thing. Thankfully, I recently unintentionally discovered your blog. I got it later bookmarked! Thank you so much for this detail. Thank you. Thank you. Thank you.
On NOAA page https://nauticalcharts.noaa.gov/updates/tag/print-on-demand-nautical-charts
the link of “print-on-demand chart printing agents” is broken. Can you please fix the page?
The print view “scale” doesn’t change as you change view zoom.
Some map details are broken and do not line up across maps. Try to zoom in on Depoe Bay, Oregon – map lines DO NOT ALIGN right on the north side of the area.
You can’t save your view as a URL, so you can’t go back to it, you have to start over.
As you change Intended Uses datasets, coastal lines change and do not match up. Overview is really way off.
And they changed it form the traditional map appearance WHICH EVERYONE IS ALREADY FAMILIAR WITH to something else, rather cartoonish.
Seriously?
Can I print a paper chart as of today March 13, 2023? I can’t see where to print or find chart?
I’ve been a supporter of electronic charts since I started using them in 1998. But I’ve never been a fan of vector charts, because of their lack of information above high water.
Nearshore, with limited aids to navigation in my area, I set courses based on lining up landmarks like hilltops or the edge of land as a double check on the GPS (particularly after I had one plotter lock up on me). The raster chart allows me to do this, showing me what geography stands out (much of it based on land contour lines), rather than a series of yellow blobs. I also use clearing lines when I need to depart these courses, again using the same process to predetermine suitable marks. The other thing I like about raster, is that on a dark and stormy night I can see important information, such as light characteristics, at a glance, rather than having to right click everything in the area.
Vector charts and GPS go hand in hand. But GPS can be affected by solar activity (cycle set to peak in 2025?). It is apparently also very easy to jam (see USCG Navigation Centre GPS Problem Report Status). There is also the issue of rising national tensions.
What happens if the GPS signal is corrupted or goes away for even a short period?
Navigators are supposed to switch their ECDIS or plotters to manual mode, then use pre-GPS navigation methods. But as noted, above high water, vector charts are pretty much a blank desert. Other than aids such as beacons and buoys, most visual and radar useful symbols (contour lines, topography symbols such as cliffs, etc.) have been removed. Any above high water marks that remain may be obscured by intervening land contours, but this will not be clear to the navigator. A few spot elevations could be isolated peaks or the highest points on a broad ridge, so are of limited value. This makes it difficult to fix with either visual bearings or radar (is the radar return from coastal cliffs or a ridge a mile or two inshore of a very low lying foreshore?). Therefore the manual mode of ECDIS will be of very limited value in many places.
With currents and leeway, a Dead Reckoning or Estimated Position plot will soon be suspect, possibly creating a poor environment for decision making.
Without charts that allow you to navigate using pre-GPS methods, a jamming or other event at a major port or choke point could turn into a National Security issue.
Maybe I’ve just missed that there will be a layer that provides land contours, more shore marks, etc. Hope so.